Sigma Notation and Riemann Sums
Area Under A Curve – Riemann Sums
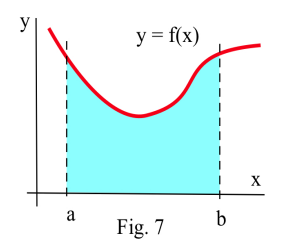
Suppose we want to calculate the area between the graph of a positive function  and the interval
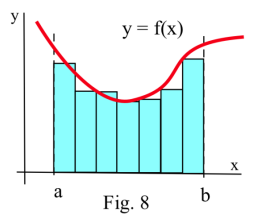
 ![[a, b]](https://dev.saylor.org/filter/tex/pix.php/022022f289db140169cd9514f74ee648.svg "[a, b]") on the x–axis (Fig. 7). The Riemann Sum method is to build several rectangles with bases on the interval and sides that reach up to the graph
of f (Fig. 8). Then the areas of the rectangles can be calculated and added together to get a number called a Riemann Sum of f on [a, b]. The area of the region formed by the rectangles is an
approximation of the area we want.
on the x–axis (Fig. 7). The Riemann Sum method is to build several rectangles with bases on the interval and sides that reach up to the graph
of f (Fig. 8). Then the areas of the rectangles can be calculated and added together to get a number called a Riemann Sum of f on [a, b]. The area of the region formed by the rectangles is an
approximation of the area we want.
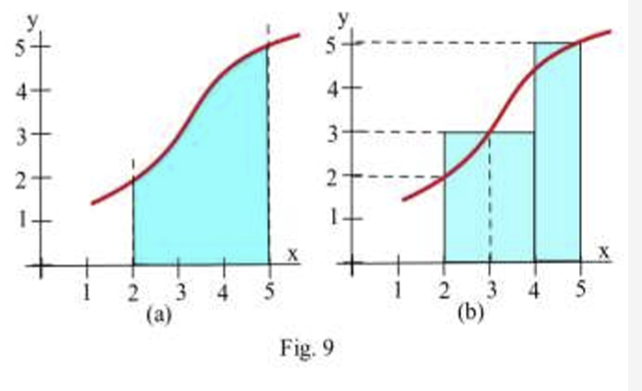
Example 5: Approximate the area in Fig. 9a between the graph of and the interval ![[2, 5]](https://dev.saylor.org/filter/tex/pix.php/9797125f5e0a4c53186448c597233b82.svg "[2, 5]") on the x–axis by summing the areas of the rectangles in Fig. 9b.
on the x–axis by summing the areas of the rectangles in Fig. 9b.
Solution: The total area of rectangles is (3) + (1)(5) = 11") square units.
square units.
In order to effectively describe this process, some new vocabulary is helpful: a partition of an interval and the mesh of the partition.
A partition  of a closed interval
 ![[a,b]](https://dev.saylor.org/filter/tex/pix.php/2c3d331bc98b44e71cb2aae9edadca7e.svg "[a,b]") into
into  subintervals is a set of
  points
  in increasing order,
  .
.
(A partition is a collection of points on the axis and it does not depend on the function in any way.)
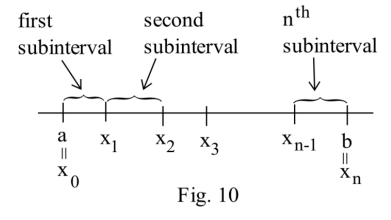
The points of the partition divide the interval into subintervals (Fig. 10): ![\left[x_{0}, x_{1}\right],\left[x_{1}, x_{2}\right],\left[x_{2}, x_{3}\right], \ldots, \text { and }\left[x_{\mathrm{n}-1}, x_{\mathrm{n}}\right]](https://dev.saylor.org/filter/tex/pix.php/4134a893fbccb885e1c1be29d050b4c7.svg "\left[x_{0}, x_{1}\right],\left[x_{1}, x_{2}\right],\left[x_{2}, x_{3}\right], \ldots, \text { and }\left[x_{\mathrm{n}-1}, x_{\mathrm{n}}\right]") with lengths
with lengths  , and
, and  . The points
  of the partition P are the locations of the vertical lines for the sides
of the rectangles, and the bases of the rectangles have lengths
of the partition P are the locations of the vertical lines for the sides
of the rectangles, and the bases of the rectangles have lengths  .
.
The mesh or norm of partition is the length of the longest of the subintervals ![\left[x_{\mathrm{k}-1}, x_{\mathrm{k}}\right]](https://dev.saylor.org/filter/tex/pix.php/c743531f505deb212b4efa489b1fe950.svg "\left[x_{\mathrm{k}-1}, x_{\mathrm{k}}\right]") , or, equivalently, the maximum of
, or, equivalently, the maximum of  .
.
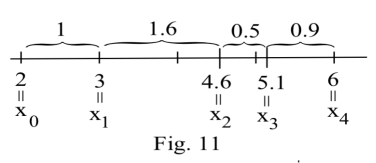
For example, the set  is a partition of the interval
 ![[2,6]](https://dev.saylor.org/filter/tex/pix.php/0115a0c32df0c9878381ac50ee93eefd.svg "[2,6]") (Fig. 11) and divides the interval into 4 subintervals with lengths
(Fig. 11) and divides the interval into 4 subintervals with lengths  . The
mesh of this partition is 1.6, the maximum of the lengths of the subintervals. (If the mesh of a partition is "small," then the length of each one of the subintervals is the same or smaller.)
. The
mesh of this partition is 1.6, the maximum of the lengths of the subintervals. (If the mesh of a partition is "small," then the length of each one of the subintervals is the same or smaller.)
Practice 6:  is a partition of what interval? How many subintervals does it create? What is the mesh of the partition? What are the values of
  and
and  ?
?
A function, a partition, and a point in each subinterval determine a Riemann sum.
Suppose is a positive function on the interval
 is a partition of .
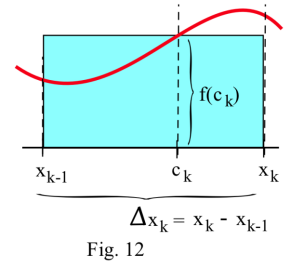
 is an x–value in the kth subinterval
 ![\left[x_{\mathrm{k}-1}, x_{\mathrm{k}}\right]: \quad x_{\mathrm{k}-1} \leq \mathrm{c}_{\mathrm{k}} \leq x_{\mathrm{k}}](https://dev.saylor.org/filter/tex/pix.php/2bb94fcb35b7fd1485033cd120f7bb18.svg "\left[x_{\mathrm{k}-1}, x_{\mathrm{k}}\right]: \quad x_{\mathrm{k}-1} \leq \mathrm{c}_{\mathrm{k}} \leq x_{\mathrm{k}}") .
.
Then the area of the kth rectangle is  \cdot\left(x_{\mathrm{k}}-x_{\mathrm{k}-1}\right)=\mathrm{f}\left(\mathrm{c}_{\mathrm{k}}\right) \cdot \Delta x_{\mathrm{k}}") . (Figure 12)
. (Figure 12)
Definition: A summation of the form  \cdot \Delta x_{\mathbf{k}}") is called a Riemann Sum of for the partition .
is called a Riemann Sum of for the partition .
This Riemann sum is the total of the areas of the rectangular regions and is an approximation of the area between the graph of f and the x–axis.
Example 6:
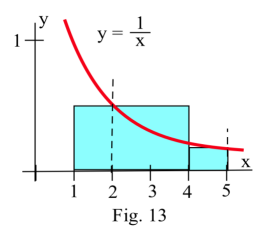
Find the Riemann sum for =1 / x") and the partition
and the partition  using the values
  and
and  . (Fig. 13)
Solution: The 2 subintervals are ![[1,4]](https://dev.saylor.org/filter/tex/pix.php/94fe668c80113341416b96929a8f1024.svg "[1,4]") and
and ![[4,5]](https://dev.saylor.org/filter/tex/pix.php/30eeb203d66f0c29522e851b605d8a9e.svg "[4,5]") so
so  and
and  .
.
Then the Riemann sum for this partition is
 \cdot \Delta x_{k} &=\sum_{k=1}^{2} \mathrm{f}\left(c_{k}\right) \cdot \Delta x_{k}=f\left(c_{1}\right) \cdot \Delta x_{1}+f\left(c_{2}\right) \cdot \Delta x_{2}=f(2) \cdot(3)+f(5) \cdot(1) \\ &=\frac{1}{2}(3)+\frac{1}{5}(1)=1.7
\end{aligned}") .
.
Practice 7:
Calculate the Riemann sum for=1 / x") on the partition using the values
on the partition using the values  .
.
Practice 8: What is the smallest value a Riemann sum for and the partition can have? (You will need to select values for  and
and  .) What is the largest value a Riemann sum can have for this function
and partition?
.) What is the largest value a Riemann sum can have for this function
and partition?
Table 2 shows the results of a computer program that calculated Riemann sums for the function with different numbers of subintervals and different ways of selecting the points  in each subinterval.
When the mesh of the partition is small (and the number of subintervals large), all of the ways of selecting the lead to approximately the same number for the Riemann sums. For this decreasing function, using the left endpoint of the subinterval
always resulted in a sun that was larger than the area. Choosing the right end point gave a value smaller that the area. Why?
Table 2: Riemann sums for on the interval ![[1,5]](https://dev.saylor.org/filter/tex/pix.php/9eba9937dac992e78a2abce3ef434e6a.svg "[1,5]")
Values of the Riemann sum for different choices of 
| number of subintervals | mesh | = left edge =  |
= "random" point in |
= right edge = |
|---|---|---|---|---|
| 4 | 1 | 2.083333 | 1.473523 | 1.283333 |
| 8 | .5 | 1.828968 | 1.633204 | 1.428968 |
| 16 | .25 | 1.714406 | 1.577806 | 1.514406 |
| 40 | .1 | 1.650237 | 1.606364 | 1.570237 |
| 400 | .01 | 1.613446 | 1.609221 | 1.605446 |
| 4000 | .001 | 1.609838 | 1.609436 | 1.609038 |
As the mesh gets smaller, all of the Riemann Sums seem to be approaching the same value, approximately ") .
.
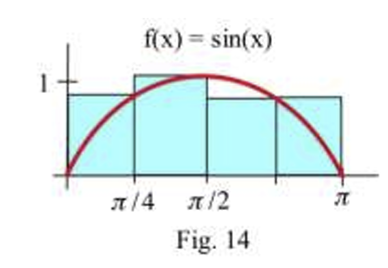
Example 7: Find the Riemann sum for the function =\sin (x)") on the interval
on the interval ![[0, \pi]](https://dev.saylor.org/filter/tex/pix.php/f74f8710fd31ce502365bc814a7fd3b6.svg "[0, \pi]") using the partition
using the partition  with
with  .
.
Solution: The 3 subintervals (Fig. 14) are ![[0, \pi / 4],[\pi / 4, \pi / 2], \text { and }[\pi / 2, \pi]](https://dev.saylor.org/filter/tex/pix.php/e580745da2b5461e655423f9d90df00b.svg "[0, \pi / 4],[\pi / 4, \pi / 2], \text { and }[\pi / 2, \pi]") , and
, and ![[\pi / 2, \pi]](https://dev.saylor.org/filter/tex/pix.php/bf30ffae9cd444a33194ec9944097508.svg "[\pi / 2, \pi]") so
so  and
and  . The Riemann
sum for this partition is
. The Riemann
sum for this partition is
 \cdot \Delta \mathrm{x}_{\mathrm{k}} &=\sin (\pi / 4) \cdot(\pi / 4)+\sin (\pi / 2) \cdot(\pi / 4)+\sin (3 \pi / 4) \cdot(\pi / 2) \\ &=\frac{\sqrt{2}}{2}
\cdot \frac{\pi}{4}+1 \cdot \frac{\pi}{4}+\frac{\sqrt{2}}{2} \cdot \frac{\pi}{2} \approx 2.45148 . \end{aligned}") .
.
Practice 9: Find the Riemann sum for the function and partition in the previous example, but use  .
.