Boxplots in ggplot2
Basic box plots
library(ggplot2)
# Basic box plot
p <- ggplot(ToothGrowth, aes(x=dose, y=len)) +
geom_boxplot()
p
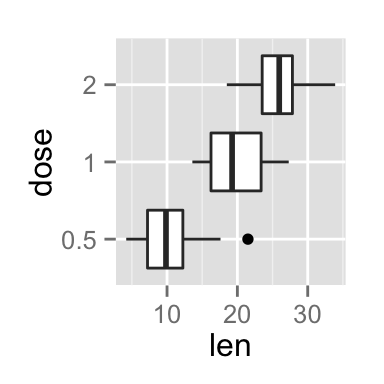
# Rotate the box plot
p + coord_flip()
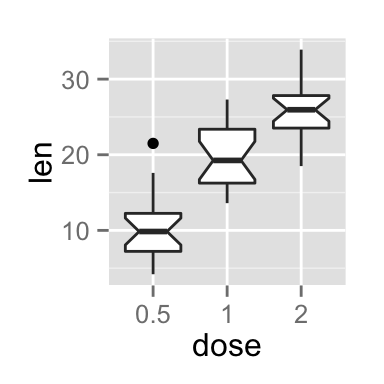
# Notched box plot
ggplot(ToothGrowth, aes(x=dose, y=len)) +
geom_boxplot(notch=TRUE)
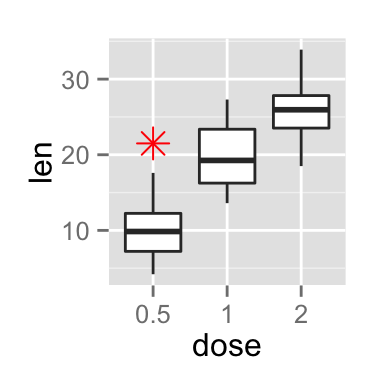
# Change outlier, color, shape and size
ggplot(ToothGrowth, aes(x=dose, y=len)) +
geom_boxplot(outlier.colour="red", outlier.shape=8,
outlier.size=4)

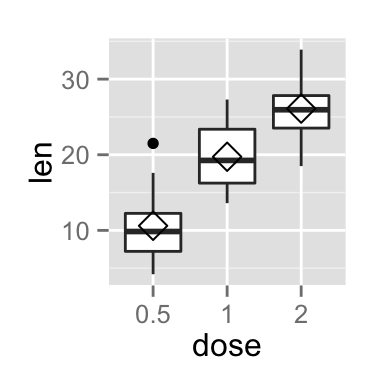
The function stat_summary() can be used to add mean points to a box plot :
# Box plot with mean points
p + stat_summary(fun.y=mean, geom="point", shape=23, size=4)
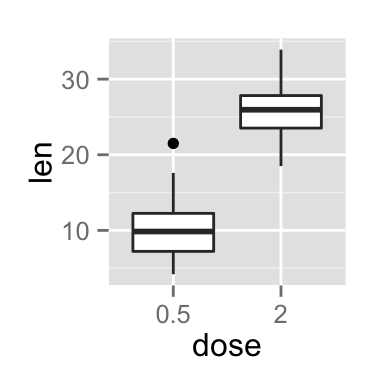
Choose which items to display :
p + scale_x_discrete(limits=c("0.5", "2"))