Boxplots in ggplot2
Box plots with dots
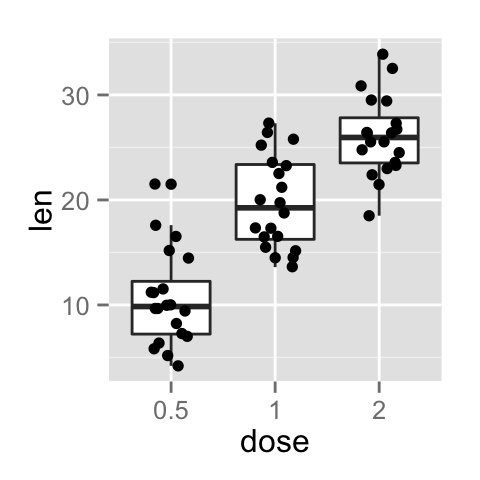
Dots (or points) can be added to a box plot using the functions geom_dotplot() or geom_jitter() :
# Box plot with dot plot
p + geom_dotplot(binaxis='y', stackdir='center', dotsize=1)
# Box plot with jittered points
# 0.2 : degree of jitter in x direction
p + geom_jitter(shape=16, position=position_jitter(0.2))