Boxplots in ggplot2
Change box plot line colors
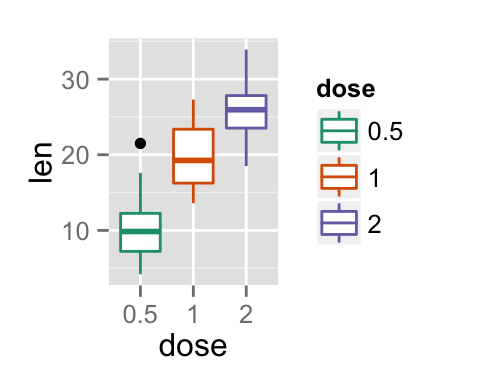
Box plot line colors can be automatically controlled by the levels of the variable dose :
# Change box plot line colors by groups
p<-ggplot(ToothGrowth, aes(x=dose, y=len, color=dose)) +
  geom_boxplot()
p
It is also possible to change manually box plot line colors using the functions :
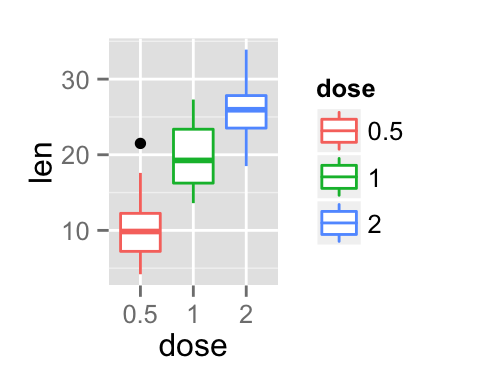
- scale_color_manual() : to use custom colors
- scale_color_brewer() : to use color palettes from RColorBrewer package
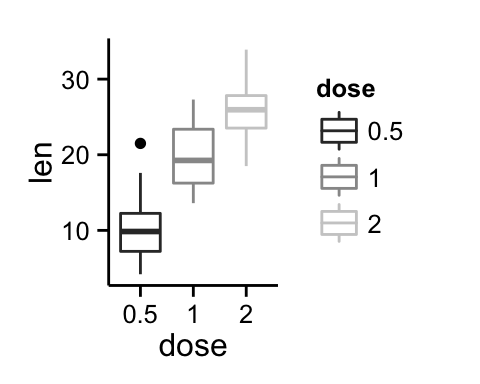
- scale_color_grey() : to use grey color palettes
# Use custom color palettes
p+scale_color_manual(values=c("#999999", "#E69F00", "#56B4E9"))
# Use brewer color palettes
p+scale_color_brewer(palette="Dark2")
# Use grey scale
p + scale_color_grey() + theme_classic()