Boxplots in ggplot2
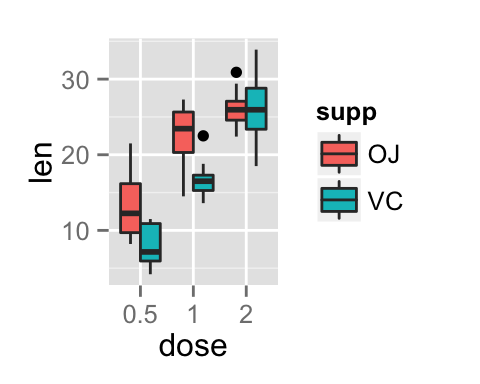
Box plot with multiple groups
# Change box plot colors by groups
ggplot(ToothGrowth, aes(x=dose, y=len, fill=supp)) +
  geom_boxplot()
# Change the position
p<-ggplot(ToothGrowth, aes(x=dose, y=len, fill=supp)) +
  geom_boxplot(position=position_dodge(1))
p

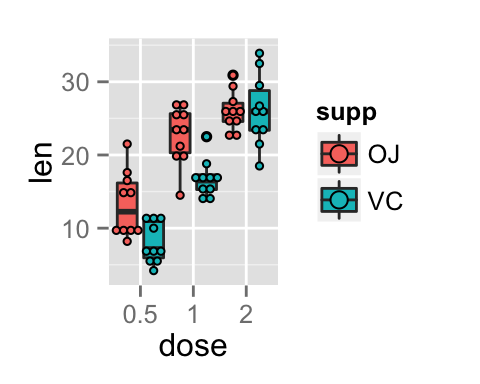
Change box plot colors and add dots :
# Add dots
p + geom_dotplot(binaxis='y', stackdir='center',
position=position_dodge(1))
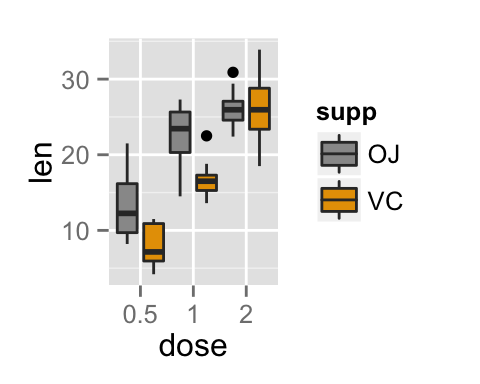
# Change colors
p+scale_fill_manual(values=c("#999999", "#E69F00", "#56B4E9"))