Boxplots in ggplot2
Customized box plots
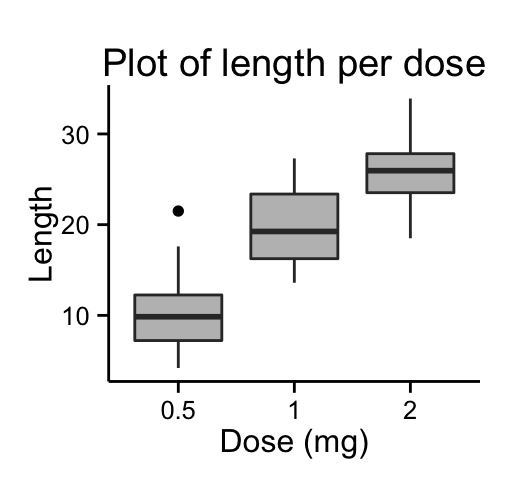
# Basic box plot
ggplot(ToothGrowth, aes(x=dose, y=len)) +
  geom_boxplot(fill="gray")+
  labs(title="Plot of length per dose",x="Dose (mg)", y = "Length")+
  theme_classic()
# Change  automatically color by groups
bp <- ggplot(ToothGrowth, aes(x=dose, y=len, fill=dose)) +
  geom_boxplot()+
  labs(title="Plot of length  per dose",x="Dose (mg)", y = "Length")
bp + theme_classic()
Change fill colors manually :
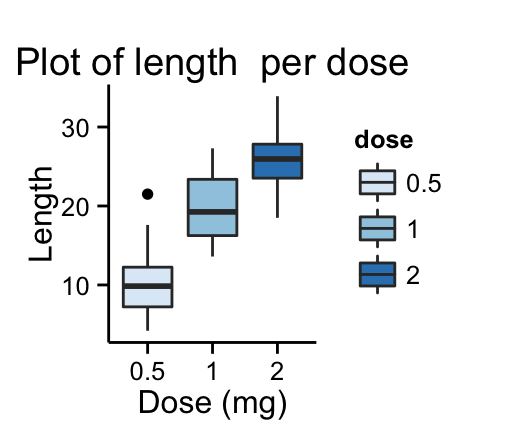
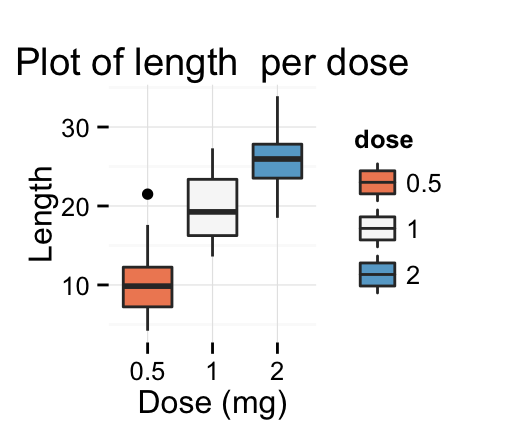
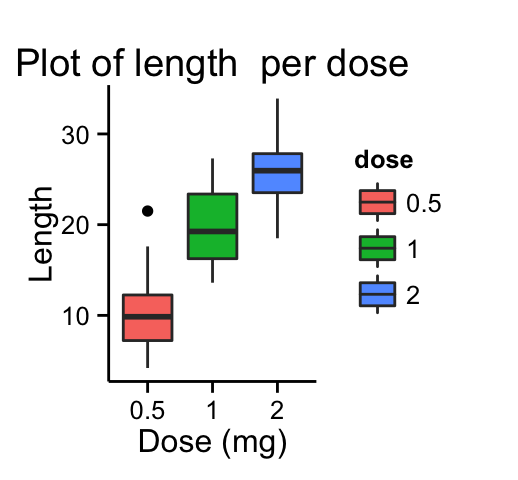
# Continuous colors
bp + scale_fill_brewer(palette="Blues") + theme_classic()
# Discrete colors
bp + scale_fill_brewer(palette="Dark2") + theme_minimal()
# Gradient colors
bp + scale_fill_brewer(palette="RdBu") + theme_minimal()