Modeling and Management of Big Data in Databases
| Site: | Saylor Academy |
| Course: | BUS610: Business Intelligence and Analytics |
| Book: | Modeling and Management of Big Data in Databases |
| Printed by: | Guest user |
| Date: | Saturday, October 19, 2024, 4:21 AM |
Description
The main real-world datasets used in the studies analyzed for this paper were sensor data, image metadata, website publications, and electronic documents. Most of the studies analyzed did not document the specific languages they used to model their data or the tool they used. But due to the need to analyze large volumes of data with various structures, which arrive in high frequency, database research became more focused on NoSQL than relational databases. Why might a NoSQL vs. Relational approach be best for database management, according to growing trends captured in this review of research?
Abstract
The work presented in this paper is motivated by the acknowledgment that a complete and updated systematic literature review (SLR) that consolidates all the research efforts for Big Data modeling and management is missing. This study answers three
research questions. The first question is how the number of published papers about Big Data modeling and management has evolved over time. The second question is whether the research is focused on semi-structured and/or unstructured data and what
techniques are applied. Finally, the third question determines what trends and gaps exist according to three key concepts: the data source, the modeling and the database. As result, 36 studies, collected from the most important scientific digital
libraries and covering the period between 2010 and 2019, were deemed relevant. Moreover, we present a complete bibliometric analysis in order to provide detailed information about the authors and the publication data in a single document. This SLR
reveal very interesting facts. For instance, Entity Relationship and document-oriented are the most researched models at the conceptual and logical abstraction level respectively and MongoDB is the most frequent implementation at the physical. Furthermore,
2.78% studies have proposed approaches oriented to hybrid databases with a real case for structured, semi-structured and unstructured data.
Source: Diana Martinez-Mosquera, Rosa Navarrete and Sergio Lujan-Mora, https://www.mdpi.com/2071-1050/12/2/634/htm
 This work is licensed under a Creative Commons Attribution 4.0 License.
1. Introduction
The Big Data modeling term became widespread in 2011, as is visible in Figure 1. This figure shows searches in Google Trends related to Big Data modeling, which are intensified from 2011 onwards. Searches before 2004 are not presented, since Google Trends does not store earlier data. In recent years, researchers have consolidated their efforts to study new paradigms to deal with Big Data. Thus, novel Big Data modeling and management in databases approaches have emerged, in line with the new requirements. In consequence, new techniques in the database context have evolved towards Not Only SQL (NoSQL).
The work presented in this paper is motivated by the acknowledgment that a complete systematic literature review (SLR) that consolidates all the research efforts for Big Data modeling and management in databases is missing. An SLR is the best way to collect, summarize and evaluate all scientific evidence about a topic. It allows for the description of research areas shown the greatest and least interest by researchers. Considering the exposed issues, the SLR conducted in this work can contribute to solving this lack by collecting and analyzing details about the research published from 2010 to 2019. As a basis for our SLR, we adhered to the guidelines proposed by Kitchenham. Moreover, this paper presents a complete bibliometric analysis and summarizes existing evidence about research on Big Data modeling and management in databases. With the information attained from the analysis performed, we will identify trends and gaps in the published research to provide a background for new research. As result, 1376 papers were obtained from scientific libraries and 36 studies were selected as relevant. All the research efforts were mapped in order to respond the three research questions defined in this research. Our main goal is to consolidate the main works to provide an awareness of the trends and the gaps related to Big Data modeling.
The remainder of this paper is organized as follows. First is the Introduction section, containing the meaning of the different terms discussed in this study. Second, a Method section presents the process used to perform the planning, conducting and reporting of the SLR. The planning phase describes the identification of the need for a SLR study and the development of a review protocol, objectives and justification, research questions and strategy. The conducting phase presents the inclusion and selection criteria for the final corpus of selected studies.
Third, the Results section answers the research questions in three subsections. The first subsection, the Bibliometric Analysis, comprises the reporting stage, including authors' information, such as affiliation and country and relevant data about their works; for instance, publication information, number of citations, funding source, year, digital library, impact factor, ranking. The second subsection, the Systematic Literature Review, presents a mapping of the selected studies according to three key concepts in a concept matrix regarding to the dataset source, modeling and database. The third subsection, the Discussion, highlights relevant findings in the SLR study in order to identify existing trends and gaps. Finally, conclusions and future works are presented.
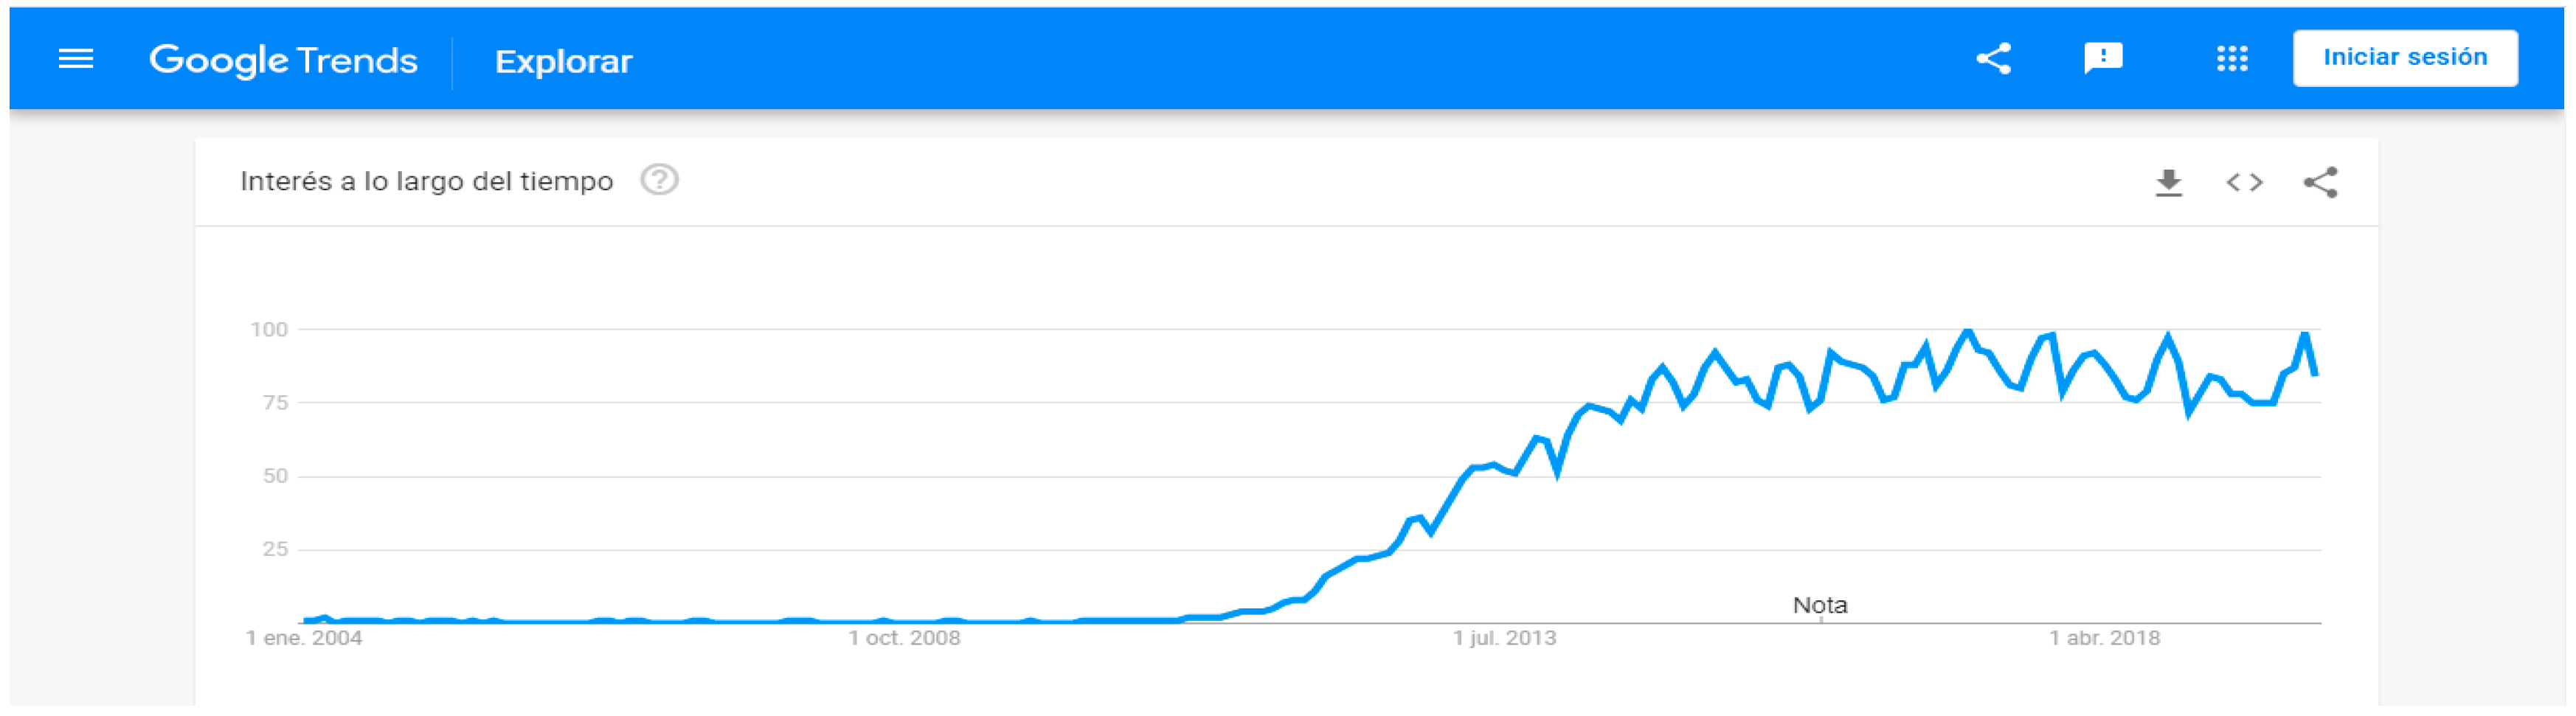
Figure 1. Trend of use of term Big Data.
1.1. Big Data Concepts
In this part, we describe the main concepts related to Big Data, in order to provide a general overview for the reader and a background of the terms discussed later.
1.1.1. A Brief History of Big Data
The production and processing of large volumes of data began to be of interest to researchers many years ago. By 1944, estimations for the size of libraries, which increased rapidly every year, were made in American universities. In 1997, at the Institute of Electrical and Electronics Engineers (IEEE) Conference on Visualization, the term "Big Data" was used for the first time during the presentation of a study about large datasets' visualization.
Big Data is the buzzword of recent years, that is, a fashionable expression in information systems. The general population relates the term Big Data to its literal meaning of large volumes of data. However, Big Data is a generic term used to refer to large and complex datasets that arise from the combination of famous Big Data V's that characterize it.
1.1.2. Big Data Characterization
As mentioned before, Big Data does not refer only to high volumes of data to be processed. At the beginning of the Big Data studies, their volume, velocity and variety were considered as fundamental characteristics, which were known as the three Vs of Big Data. After advances in the research, new Vs, such as value and veracity, were established. Currently, there are authors who propose up to 42 characteristics needed to consider data as Big Data, therefore, they define 42 Vs for Big Data. For the purposes of our study, we will mention only ten Vs of Big Data, that are presented in a scientific study. Table 1 summarizes each characteristic, along with a brief description.
Table 1. Ten Vs Big Data.
| Characteristic |
Brief Description |
|---|---|
| Volume | Large data sets |
| Velocity | High data generation rate |
| Variety | Different type of data formats |
| Variability | Consistent data |
| Viscosity | Data velocity variations |
| Virality | Data transmission rate |
| Veracity | Accuracy of data |
| Validity | Assessment of data |
| Visualization | Data symbolization |
| Value | Useful data to retrieve info |
1.1.3. Volume and Velocity
To deal with the Volume and Velocity characteristics of Big Data, ecosystems and architectural solutions, such as lambda and kappa, have been created. Both architectures propose a structure of layers to process Big Data; the main difference between them is that lambda proposes a layer for batch data processing and another for streaming data, while kappa proposes a single layer for both batch and streaming processing. This SLR focuses on data modeling, a concept related to the Variety characteristic, which is explained next.
1.1.4. Variety
Variety is a characteristic referring to the different types of data and the categories and management of a big data repository. As per this characteristic, Big Data has been classified into structured, semi-structured and unstructured data. The next subsections explain in detail each data type.
Structured Data
In Big Data, structured data are represented in tabular form, in spreadsheets or relational databases. To deal with this type of data, widely developed and known technologies and techniques are used. However, according to the report presented by the CISCO company, this type of data only constituted 10% of all existing data in 2014. Therefore, it is very important to analyze the 90% of the remaining data, corresponding to the semi-structured data and unstructured data that will be described below.
Semi-Structured Data
Semi-structured data are considered to be data that do not obey a formal structure, such as a relational database model. However, they present an internal organization that facilitates its processing; for instance, servers' logs in comma-separated values (csv) format, documents in eXtensible Markup Language (XML) format, JavaScript Object Notation (JSON) and Binary JSON (BSON) and so forth. Some authors may consider XML and JSON as structured.
Unstructured Data
Unstructured data are considered those that have either no predefined schema or no organization in their structure. Within this type of data are text documents, emails, sensor data, audio files, images files, video files, data from websites, chats, electronic health records, social media data and spatio-temporal data, among others. According to CISCO, the volume of unstructured data between 2017 and 2022 is expected to increase up to twelvefold.
To support the Variety, Volume and Velocity of Big Data, non-relational, distributed and open source data storage systems have been created. These systems include horizontal scalability, linearization, high availability and fault tolerance. Usually, these
databases are known as NoSQL.
1.2. NoSQL
The existing paradigms for dealing with regular data are neither enough nor suitable to deal with Big Data requirements. For that reason, at the data storage level, the introduction of novel approaches, such as the NoSQL databases, is required. NoSQL refers to Not Only SQL, the term used for all the non-relational databases. NoSQL databases are considered schema-less, as they are designed to work without structure; however, in practice, there is a need for a self-sufficient model to define how data will be organized and retrieved from the database. To solve this requirement, some diverse NoSQL data models are proposed.
Data Models
A data model is a representation of the structure of the data for processing and organization. A data model is considered a primary element for storage, analysis and processing in storage systems.
Currently, storage systems are classified into two
large groups, relational and non-relational. Within the relational, the well-known models are the Entity–Relationship (ER), Extended Entity Relationship (EER), Key-Cube and Multidimensional, among others. The objective of this article is not to present
a deep study of the models considered as classic: they are well-known and do not need to be explained. We only develop a study of the models that are a novelty for Big Data.
For non-relational systems, there are the NoSQL databases; for them, the
data models are classified into four main categories:
- Column-oriented
- Document-oriented
- Graph
- Key-value
Column-Oriented
In this model, data are represented in tabular form by columns and rows. The columns are identifiable by a partition key that is unique and mandatory and the rows by an optional clustering key. The primary key is the combination of the partition and clustering key. Basically, the schema of the tables consists of a set of columns, a primary key and a data type. For Database Management Systems (DBMS) that use the column-oriented data model, we can mention Accumulo, Amazon SimpleDB, Cassandra, Cloudata, Druid, Elassandra, Flink, HBase, Hortonworks, HPCC, Hypertable, IBM Informix, Kudu, MonetDB, Scylla and Splice Machine, among others.
Document-Oriented
In this model, data are stored in key-value pairs, value documents in XML, JSON or BSON formats. Each of the documents can have nested subdocuments, indexes, fields and attributes. As examples of DBMS that use the document-oriented data model, we can mention ArangoDB, Azure, BagriDB, Cloud Datastore, CouchDB, DocumentDB, Elastic, IBM Cloudant, MongoDB, NosDB, RavenDB, RethinkDB, SequoiaDB, ToroDB and UnQlite, among others.
Graph
This model consists of a graph that contains nodes and edges. A node represents an entity and an edge represents the relationship between entities. There are several graph structures: Undirected/directed, Labeled graphs, Attributed graphs, Bigdata, Multigraphs, Hypergraphs and Nested graphs, among others. Some examples of DBMS that use the graph data model are AllegroGraph, ArangoDB, Infinite Graph, GraphBase, HyperGraphDB, InfoGrid, Meronymy, Neo4j, Onyx Database, Titan, Trinity, Virtuoso OpenLink, Sparksee and WhiteDB.
Key-value
In this model, the data are represented by a key-value tuple. The key represents a unique identifier indexed to a value that represents data of arbitrary type, structure and size. Secondary keys and indexes are not supported. Aerospike, Azure Table Storage,
BangDB, Berkeley DB, DynamoDB, GenieDB, KeyDB, Redis, Riak, Scalaris, Voldemort, among others are examples of DBMS that use the key-value data model.
Table 2 summarizes the main characteristics of NoSQL data models, such as its main concept, structure,
techniques to create the data model, advantages and disadvantages.
Table 2. NoSQL characteristics.
| Characteristic/Data Model | Column-Oriented | Document-Oriented | Graph-Oriented | Key-Value |
|---|---|---|---|---|
| Concept | A model that allows representing data in columns | A model that allows representing data via structured text | A model that allows representing data and their connections | A model that allows representing the data in a simple format (key and values) |
| Structure | Data are stored in tables | Nesting of key-value pairs | Set of data objects (nodes) | Tuple of two strings (key and value) |
| Each document identified by a unique identifier | Set of links between the objects (edges) | A key represents any entity's attribute | ||
| Values in a column are stored consecutively | Any value can be a structured document | Values can be of any data type | ||
| Key and value are separated by a colon ":" | ||||
| Key-value pairs are separated by commas "," | ||||
| Data enclosed in curly braces denotes documents | ||||
| Data enclosed in square brackets denotes array collection | ||||
| Techniques | With compression: Lightweight encoding Bit-vector encoding Dictionary encoding Frame of reference encoding Differential encoding |
Denormalized flat model | Simple direct graph Undirected multigraph Directed multigraph | NA |
| Denormalized model with more structure (metadata) | Weighted graph | |||
| With join algorithm | Shattered, equivalent to normalization (https://pdfs.semanticscholar.org/ea15/945ce9ec0c12b92794b8ace69ce44ebe40cc.pdf) | Hypergraph | ||
| With late materialization | Nested graph | |||
| Tuple at a time | ||||
| Applications | Consumer data Inventory data |
JSON documents XML documents |
Social networks Supply-chain Medical records IT operations Transports |
User profiles and their attributes |
| Advantages | High performance in loading and querying operations Efficient data compression and partitioning (both horizontally and vertically) Scalability Support for massive parallel processing Well-suited for Online Analytical Processing and OnLine Transaction Processing workloads |
Support for multiple document types Support for atomicity, consistency, isolation and durability transactions Scalability Suitable for complex data, nested documents and arrays |
Easy modeling Fast and simple querying Scalability |
Easy design and implementation Fault tolerance Redundancy Scalability High speed |
| Disadvantages | Difficult to use wide-columns Delays in querying specific data |
Information duplication across multiple documents Inconsistencies in complex designs |
Lack of a standard declarative language Support to limited concurrency and parallelism |
Very basic query language Some queries can only depend on the primary key |
1.3. Data Abstraction Levels
Generally, in the design of both relational and NoSQL databases, three levels of abstraction are used: conceptual, logical and physical. Data modeling is understood as the technique that records the features of data elements in a map that describes the data used in a process. Data modeling illustrates how the data elements are organized and related. Relational modeling methodologies have well established procedures, as a result of decades of research; however, for NoSQL databases the modeling methodologies, specifically for Big Data, are a novel topic that continues to be studied.
Data modeling at the conceptual level is closely related to the scope of the business process. Therefore, the conceptual model is technologic-agnostic and independent of the database to be used. Thus, already-known models for relational databases can be used in non-relational databases. At the logical level, the modeling is focused on the data model to be used. For NoSQL databases, the modeling is aimed at representing the data structure of the column-oriented, document-oriented, graph or key-value models, as described previously. On the physical level, the modeling will represent the own schema of the selected database; that is, the specific implementation of the NoSQL database, such as Cassandra or MongoDB.
2. Method
This SLR study was undertaken based on the guidelines proposed by Kitchenham, resulting in a three-phase division: (1) planning the SLR study, (2) conducting the SLR study and (3) reporting the SLR study. Figure 2 summarizes the phases in our SLR study.
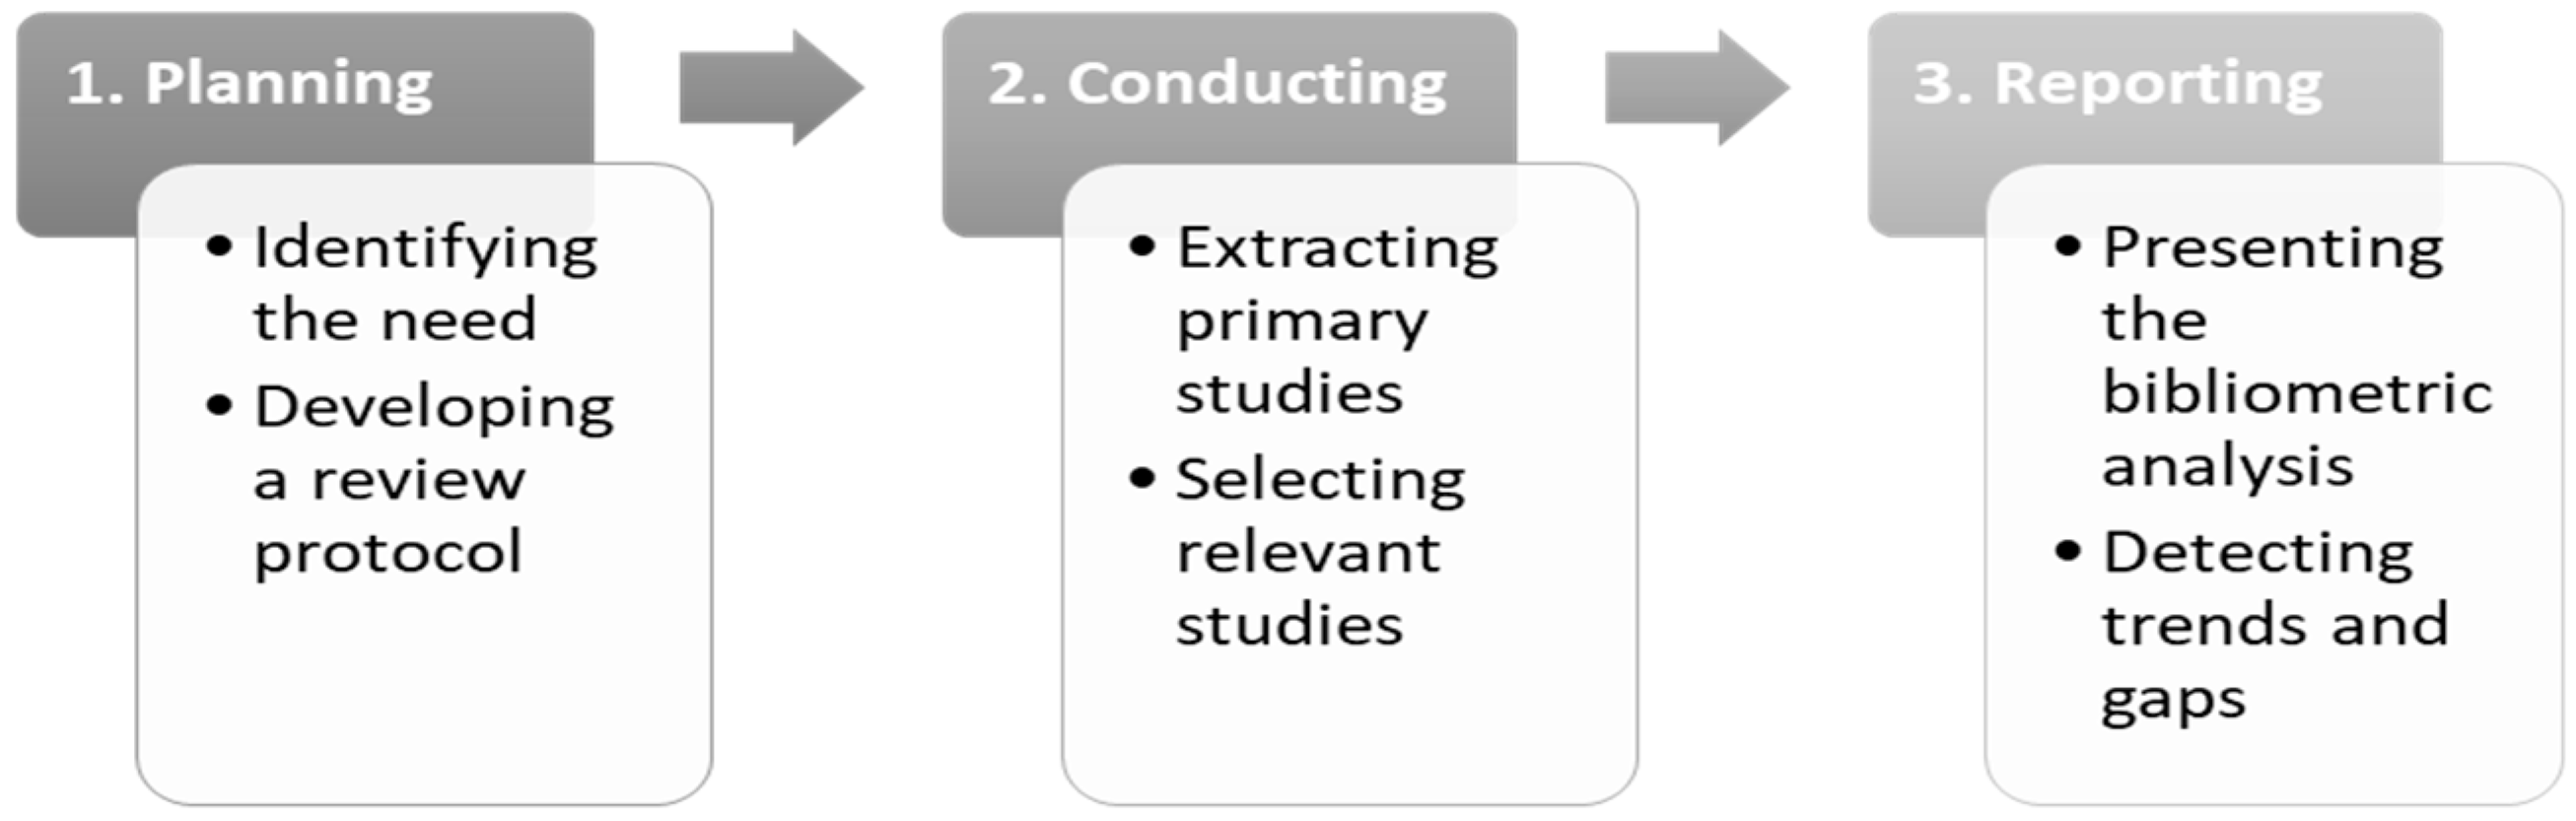
Figure 2. Systematic Literature Review phases.
The activities included in the first phase were checking the existence of other SLR studies about the topic of interest; defining the review protocol to be applied in order to mitigate possible biases from involved researchers; conceiving objectives, justifications and research questions; and, finally, defining the strategy to be pursued.
In the second phase, the activities were to collect the primary studies from the sources defined by the planning step and subsequently apply the criteria for inclusion to select only those studies related to Big Data modeling.
At last, in the third phase, the corresponding activities were to perform a full bibliometric analysis to provide the information about the authors and publication data in a single document. Furthermore, each selected relevant study was mapped to several key concepts. The analysis results allowed us to answer the research questions.
Each phase is further elaborated in the next subsections.
2.1. Planning the SLR Study
The main goals of this phase are the identification of the need for a SLR study and the development of a review protocol.
2.1.1. Identification of need for a SLR study
Following the suggestions provided by some works, we searched for SLRs and similar publications related to Big Data modeling and management, to verify if there was a gap that could be covered with the SLR proposed in this work. We found four works dating 2015, 2016, 2017 and 2018, which are described below.
Ribeiro, Silva and Rodrigues da Silva completed a survey in 2015 focused on data modeling and data analytics. Although not an SLR study, the work describes some concepts that are relevant to the Big Data models. The authors identified the four main data models for Big Data - key-value, document, wide-column and graph - also described in our work. They also presented a brief summary of the abstraction levels, concepts, languages, modeling tools and database tools support. However, their study is not as detailed as ours, nor do they present a bibliometric analysis. For instance, there is a lack of information about the data models used at the conceptual, logical and physical levels, the techniques used for transforming towards the different abstraction levels, the research trends, which data set sources, types and models for Big Data are the most studied and so forth. Furthermore, our SLR is up to date on August 2019. Nevertheless and similarly to us, the study pays special attention to the fact that Big Data modeling and management in databases must be considered for research, documentation and development, as they demonstrate the data modeling necessity as a means to improve the development process in Big Data. However, they do not cover the criteria that we have mentioned before.
Sousa and Val Cura cover the 2012 to 2016 timeframe. They present an SLR study about logical modeling for NoSQL databases. The authors nominate 12 articles and classify them under conceptual, logical and physical levels. They also identify modeling proposals for NoSQL databases, for NoSQL databases' migration and layers' proposals. We do not consider it as a complete work, since in our research we examined 1376 articles about Big Data modeling and management. Furthermore, they conclude that no research about data model conversion from conceptual to logical level existed at this time, even though our findings revealed the existence of several studies related to it.
Davoudian, Chen and Liu present a thorough study of all the concepts and techniques used in NoSQL databases; the data models used in Big Data are described but in our work we also present a deep study on Big Data modeling methods. This is considered as a relevant work but it does not show a bibliometric analysis of all authors, conferences and journals, among other relevant information to know the trends and gaps in this topic of research. Additionally, our work focuses on examining each of the studies conducted in research to give researchers a guide to current approaches and future directions.
Wu, Sark and Zhu identify some NoSQL databases and focuses to compare them according to their data model and the theorem, which indicates that a distributed system can only guarantee two of the following three properties simultaneously: Consistency, Availability and Partition tolerance (CAP). This work also does not consist of an SLR like the one presented in this work.
Furthermore, other recent surveys related to Big Data have been published; for instance, one describing the state-of-the-art about methodologies developed for multimedia Big Data analytics and the challenges, techniques, applications, strategies and future outlook. Another study presents and analyzes in detail the current stage of Big Data environments and platforms and available garbage collection algorithms. These works neither cover the scope of our research questions for Big Data modeling and management, nor achieve the same level of detail and precision.
In the next subsection, we detail the development of our review protocol, asserting our objectives and justification and the research questions.
2.1.2. Development of a Review Protocol
A review protocol is essential in order to mitigate any possible bias from researchers and it must be defined before conducting the SLR. Thus, during this stage, we formed the applied method. First, we proposed specific development goals and the respective
justification for our work. Then, we formulated three research questions with the intent of summarizing the existing evidence about Big Data modeling and management. Finally, we elaborated a strategy to conduct this SLR study effectively.
Objectives and Justification
The first objective is to present information about the most relevant research about Big Data modeling and management in a comprehensive bibliometric analysis. This study contains a number of studies from the digital libraries
and details the authors, their institutional affiliations, countries and publication details, such as the publication year and their impact factors in the Journal Citation Reports (JCR) and the Scimago Journal Rank (SJR) for journals and in the CORE
Ranking for Conferences.
Based on our findings, the second objective was to detect the different approaches for Big Data modeling used in the different studies in order to determine trends and gaps within the three key concepts, source, modeling
and database. The SLR study conducted in this research can focus all the research related to Big Data modeling into a single document, to benefit the industry, the academy and the community.
Research Questions
This stage comprises the most important
phase of the protocol development. Hence, we took particular care while following Kitchenham's suggestions. Firstly, we identified three actors within the population: (1) researchers, (2) information analysts and (3) software developers who research,
document and implement solutions for Big Data modeling and management in databases. Secondly, we considered collecting all the approaches related to data modeling oriented to Big Data. Thirdly, as outcomes, we intend to summarize the findings and
determine the trends and gaps in the studied topic. This study raised the following research questions:
Research Question (RQ1): How has the number of published papers about Big Data modeling and management changed over time?
Rationale: Our interest is to consolidate, through a bibliometric analysis, all the research efforts for the topic, providing researchers with the ability to know all the information about the authors and the publication data in a single document. Thus, the reader can know how the studies, in our topic of interest, have grown over time, who were the authors who provided significant contributions towards the subject, which are the most cited studies and which countries are most interested in this research topic, as well as which journals and conferences are involved in this topic and which scientific libraries have the major share of studies about Big Data modeling and management. In addition, we wanted to know whether these researches were mostly funded by industry or the academy.
Research Question (RQ2): Are there any research studies that focus on approaches for semi-structured and unstructured data and what techniques to apply?
Rationale: Our goal is to find out whether the studies are focused
on semi-structured and unstructured data, which, according to the data specified in the Big Data Concepts subsection, comprised most of the available data. In addition, we intend to present what models the researchers propose at each modeling abstraction
level and to determine three key concepts: source, modeling and database:
- For source: The dataset sources and data types;
- For modeling: The data abstraction levels, the data model proposed at conceptual, logical and physical levels, the techniques used for transformations between abstraction levels, the applied modeling language, the modeling methodology and the proposed tools for automatic model transformation;
- For database:
The database type and the evaluation and performance comparison between models.
Research Question (RQ3): What are the trends and gaps in Big Data modeling and management?
Rationale: Based on the data obtained in RQ2, our main interest is to present the solutions proposed by researchers in this topic in a consolidated work. The objective is to allow researchers to focus their efforts on the gaps and solutions that allow for standardization over the currently existent or novel methods.
Strategy
The
strategy to conduct an exhaustive compilation of studies on the topic of interest included four actions:
1. Finding primary studies from scientific digital libraries, mainly considering whether: (1) they contain indexed research documents, (2)
there is a high frequency of databases update and (3) they publish related research about our topic of interest. The sources listed below comply with the desired requirements, in order to focus our systematic review of relevant research:
- IEEE Xplore
- ScienceDirect
- Scopus
- Web of Science (WoS)
Moreover, according to a comprehensive study, which evaluated the quality of 28 scientific search systems, Google Scholar is inappropriate as principal search system, while ScienceDirect, Scopus and WoS are suitable to evidence synthesis in an SLR.
2. Applying the inclusion criteria to the primary studies, in order to select those studies related to Big Data
modeling and management, we conducted a search of a specific terms-matching process within the articles' titles, abstracts and keywords. Based on our research questions, two major search terms were derived: big data and model. The terms were selected
after combining several options, in order to get a significant number of articles and these terms covered the majority of studies that addressed our research subject.
Due to the fact that the selected digital libraries do not share a common search
syntax, we enumerated all the search strings applied in each one. The word "model" has been used because some studies use this term when referring to modeling:
- IEEE Xplore - ((("Document Title":"big data" and "data model") OR "Abstract":"big data" and "data model") OR "Index Terms":"big data" and "data model")
- ScienceDirect - Title, abstract, keywords: "big data" and "data model"
- Scopus - TITLE-ABS-KEY ("big data" AND "data model")
- WoS - TS = ("big data" AND "data model"). TS regards to Topic fields that include titles, abstracts and keywords.
For the inclusion criteria, only studies written in English and published in conferences or journals
were considered. Although no date-limiting factor was defined in our search criteria, it was observed that no results prior to 2010 were returned by any selected scientific library. These results match with Figure 1, where a report from Google Trends
demonstrates that the term Big Data started to become popular in 2011;
3. Reviewing the studies for a second time through a reading of the papers' content allowed us to discard the ones not relevant to the context of our topic of interest;
4. The
snowballing technique was applied to locate additional relevant articles according to existing references from within the already-reviewed studies.
2.2. Conducting the SLR Study
The search of the SLR study was conducted in August 2019. Figure 3 provides a representation of the selection process applied to the studies. Duplicated studies were discarded from the potentially relevant studies stage.
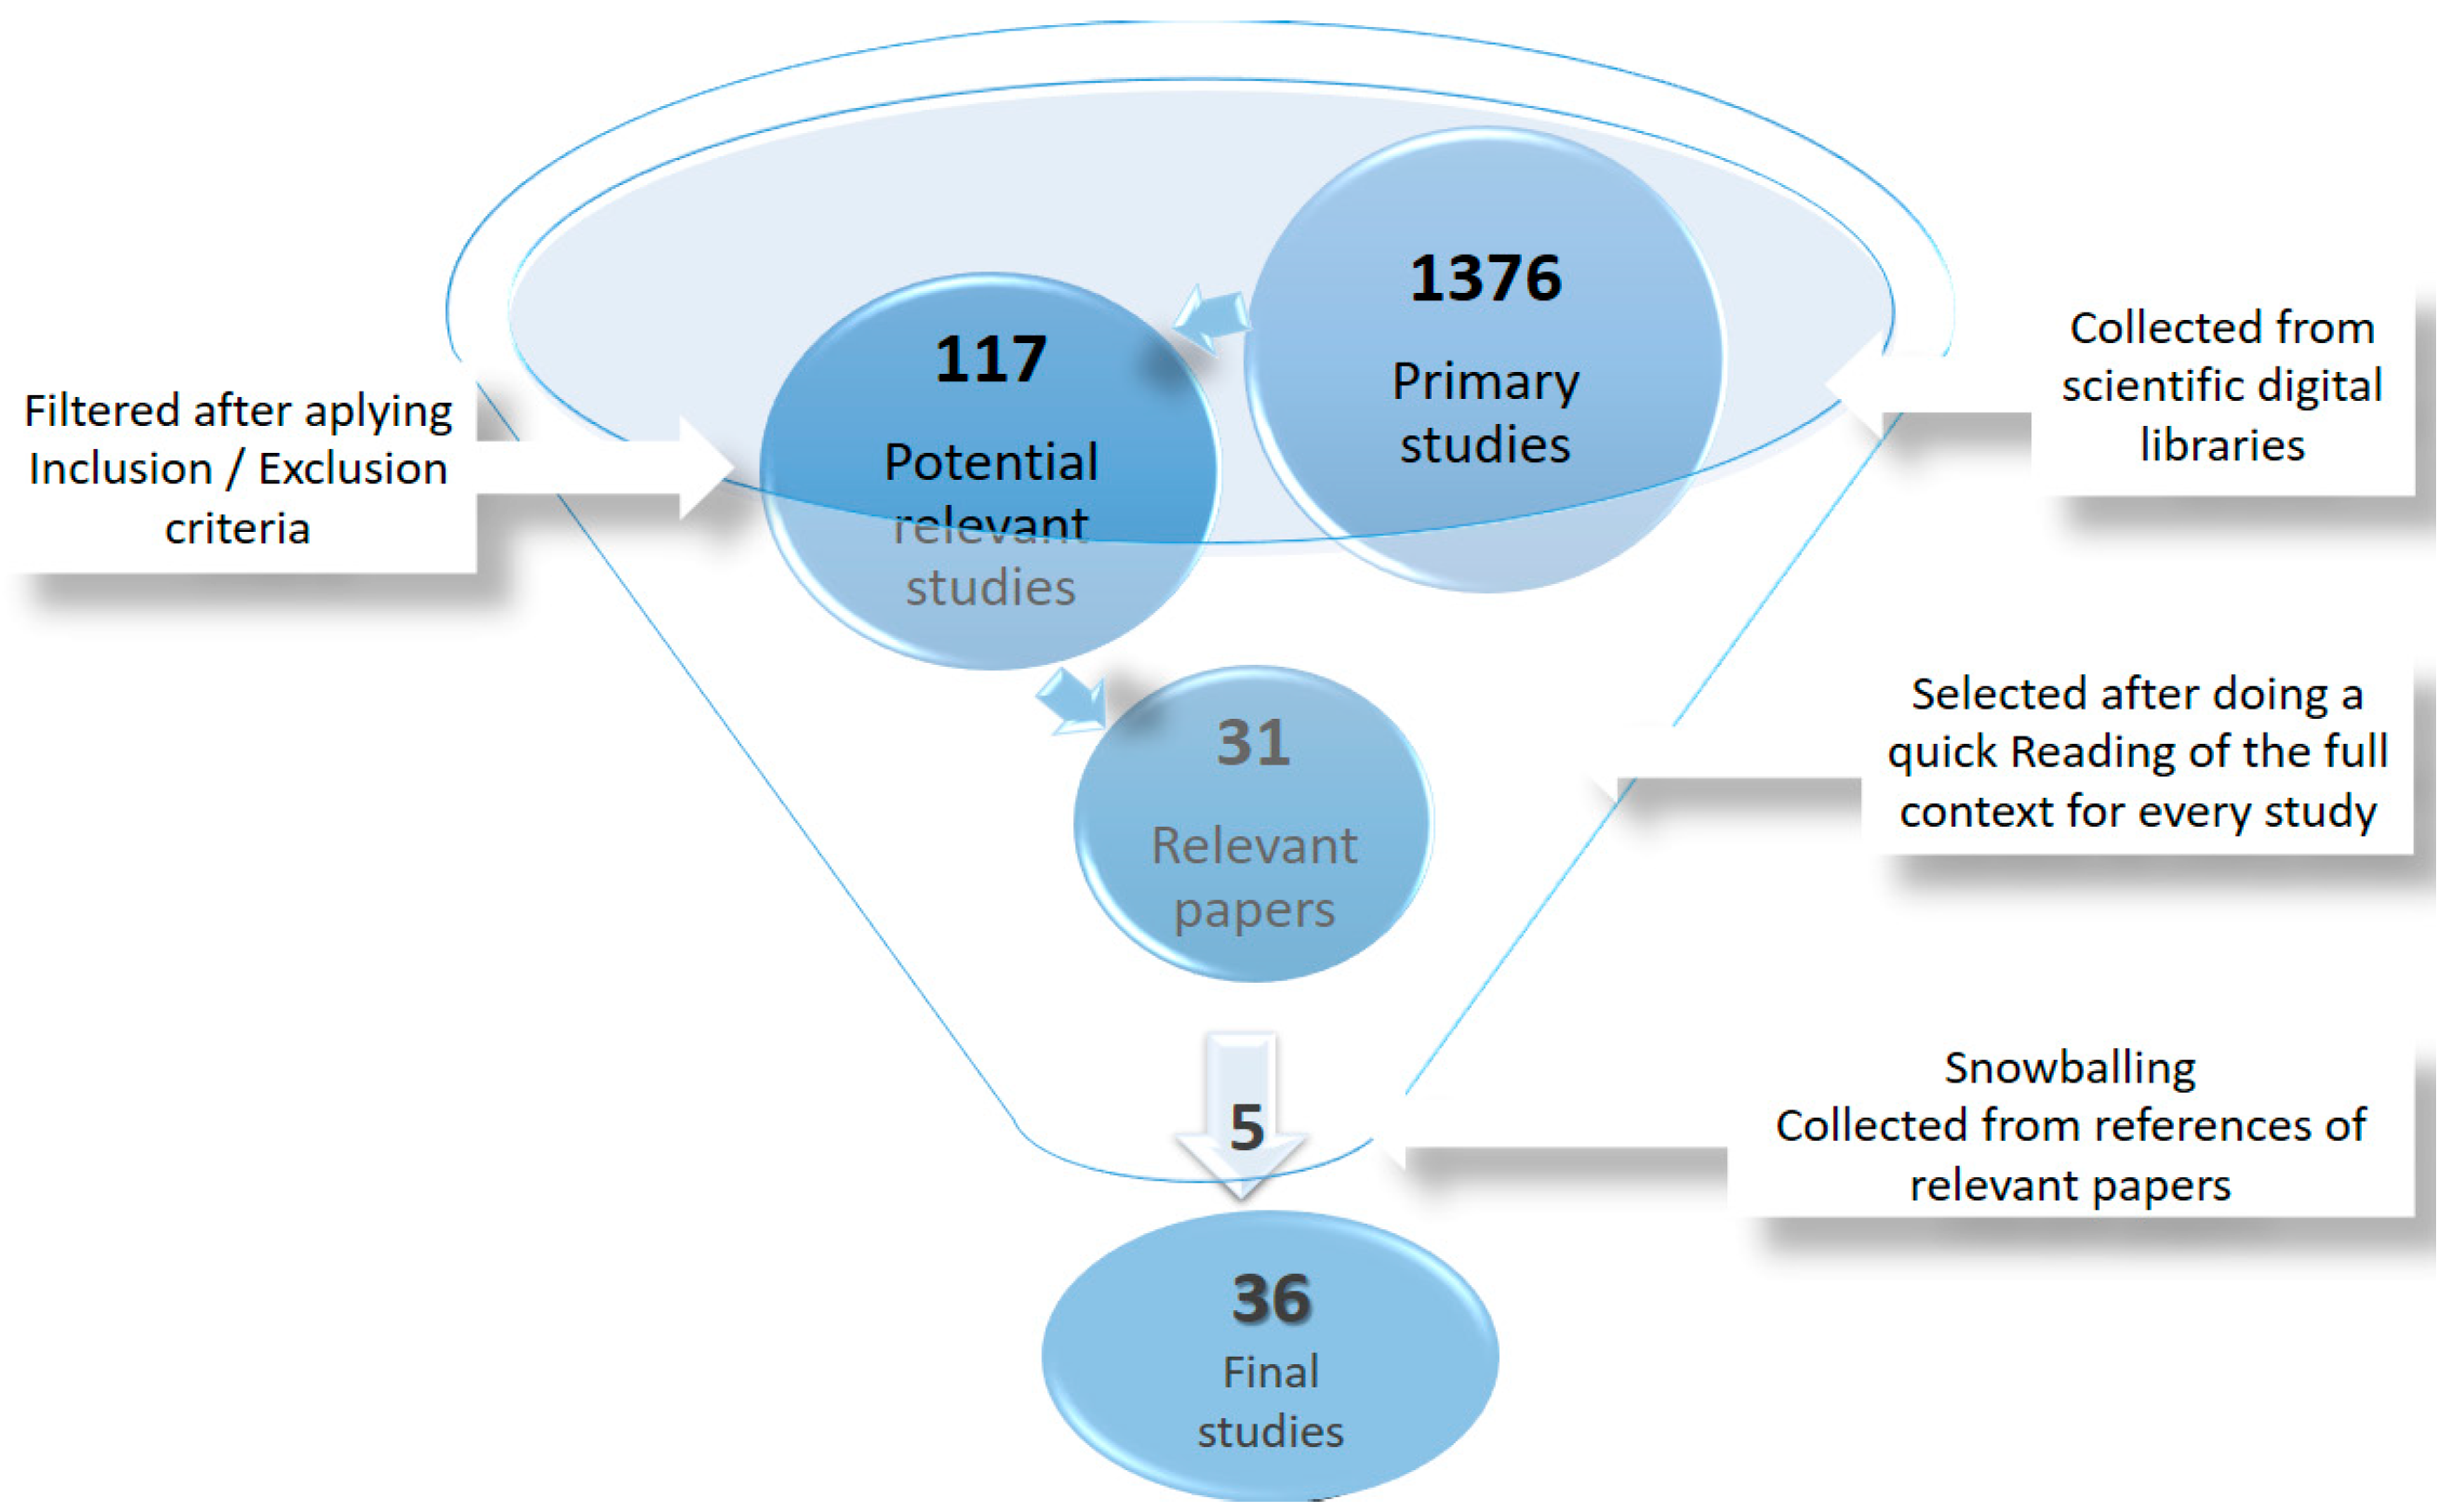
Figure 3. Selection Process
2.2.1. Inclusion Stage
In this stage, we selected studies related to Big Data modeling and checked their titles, abstracts and keywords according to the previously planned strategy. We considered only English studies that addressed our research questions and published in conferences or journals. Our main objective is to identify the different approaches to data modeling and management in data stores in a general way for the different types of data at the three abstraction levels. As a result, 1 Chinese article and 27 articles corresponding to books, book chapters, letters, notes or editorials, were discarded. Additionally, we also discarded 1259 articles that, although mentioning data models, referred to specific applications or not related to data persistence but to data ingestion, data lakes or data analytics. From this stage, 117 studies were accepted.
2.2.2. Selection Stage
At this stage, a quick review of the full content of every study allowed us to select only those studies related to Big Data modeling. This resulted in the acceptance of 31 studies, the rejection of 70 papers and the filtering of 16 duplicated works.
At this phase, we eliminated the duplicated papers.
After scanning the whole content of these selected 31 studies, we also included five new papers after the snowballing review. Finally, 36 studies made up our final corpus to report the SLR study.
2.3. Reporting the SLR Study
The objective of this step is to answer the research questions raised in the review protocol. For this purpose, this study is divided into three parts. In the first part, we perform a bibliometric analysis to answer RQ1; in the second part, we present the literary review with the most relevant data of the approaches in a concept matrix to answer RQ2; and in the third part, we discuss the trends and gaps to answer RQ3. Section 3 presents in detail the results collected from the activities described in this phase.
3. Results
In this section, we answer the research questions via the below activities:
1. A bibliometric analysis, to gather information about the authors and the publication data, the authors and countries with more contributions in the subject, the impact of the selected studies and how the research has grown throughout time, as well as the journals and conferences proceedings where the studies were published;
2. A literature review to map the studies according to three key concepts - source, modeling and database - in a concept matrix. In the source concept, we analyze the dataset sources and data types. In the modeling concept, we analyze the data abstraction levels, the data models proposed at the conceptual, logical and physical levels, the techniques used to perform transformations between abstraction levels, the applied modeling language, the modeling methodology and the proposed modeling tools. At the database concept, we analyze the type and conduct an evaluation and performance comparison between models;
3. A discussion to identify trends and gaps in Big Data modeling and management.
3.1. Bibliometric Analysis
The objective of this analysis is to answer RQ1. To answer the first part of the rationale of this question, we analyze the results of the inclusion and selection stages. In Figure 4, we summarize the results of the inclusion stage and highlight some findings:
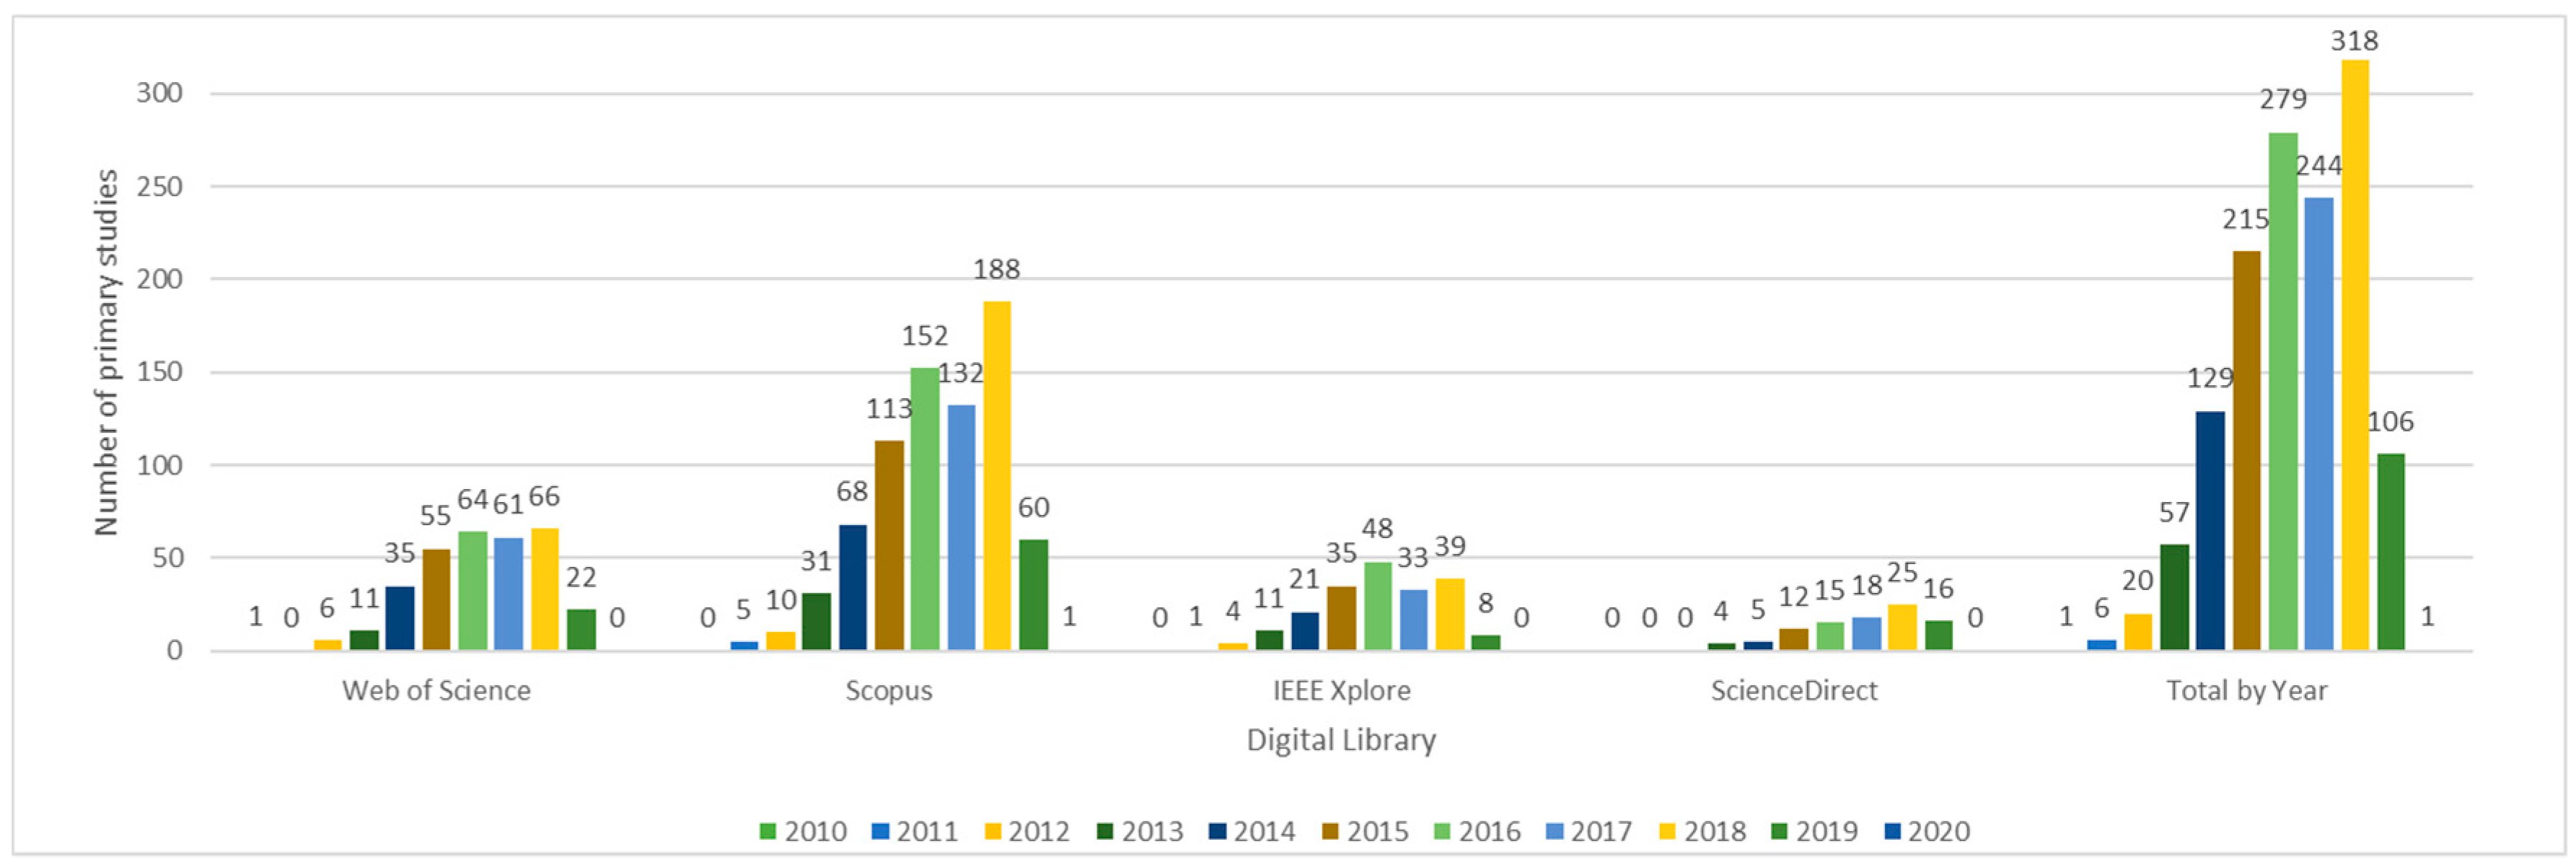
Figure 4. Number of primary studies by year and source.
- The average annual growth rate of published articles follows Equation (1)

- Prior to 2010, no relevant studies about Big Data modeling are published
- Since 2015, the number of studies has increased significantly and, in 2018, there were 318 published articles. In 2019, there were already 106 publications before August
- Scopus ranked the highest of all considered sources, with 760 collected works, followed by WoS with 321 works, IEEE Xplore with 200 and ScienceDirect with 95
The results of the selection stage are presented in Figure 5, organized by source and year. We can highlight the following findings:
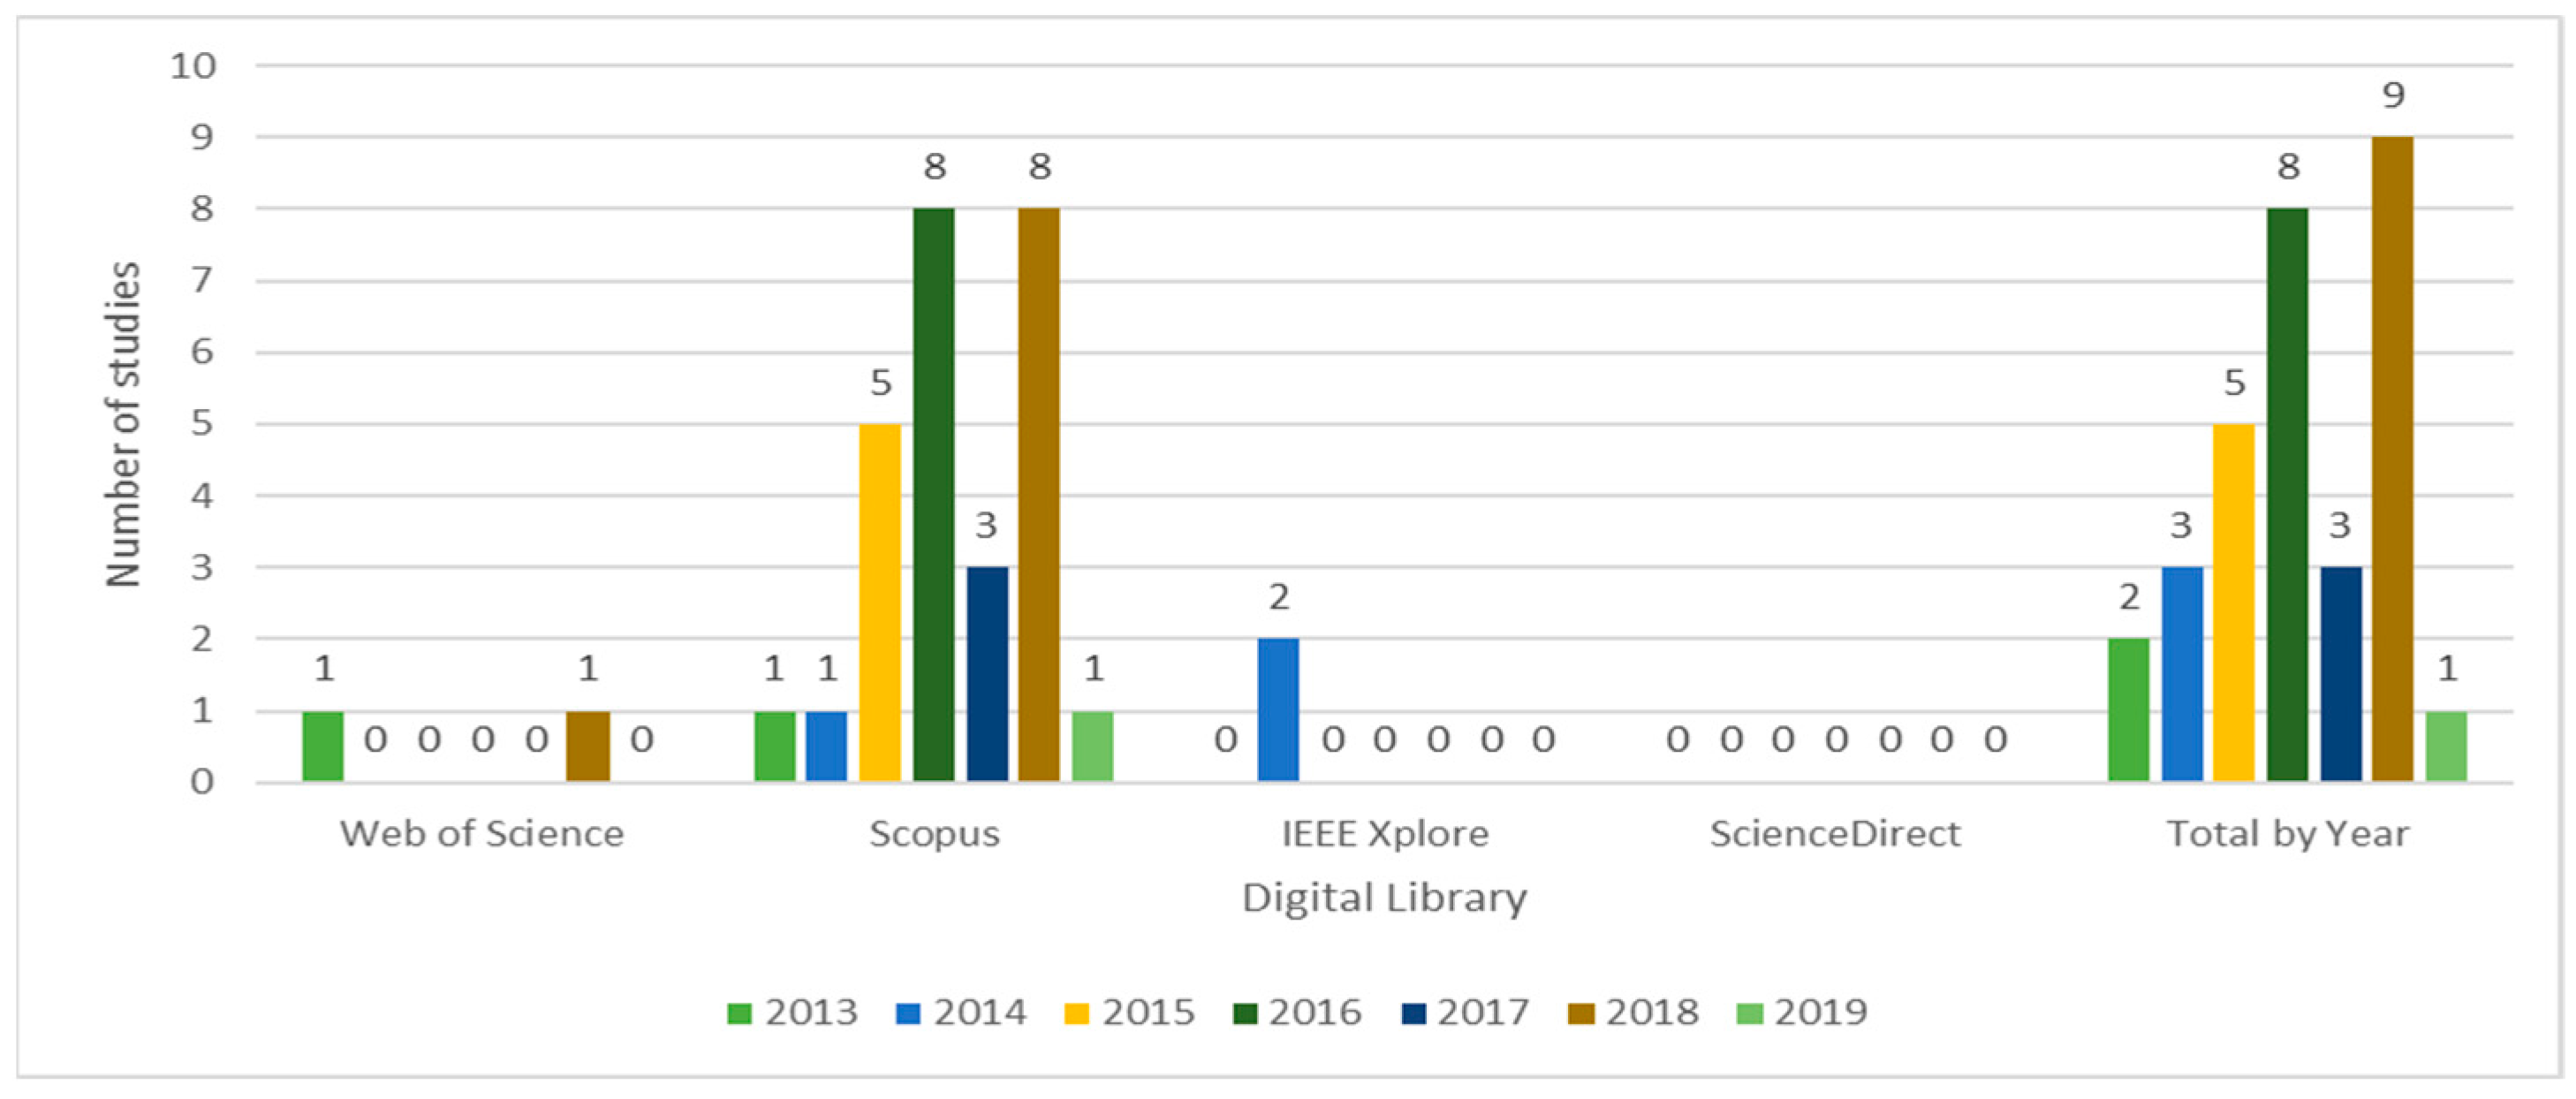
Figure 5. Results of selection stage.
- Prior to 2013, no relevant studies were found;
- The year in which we found the most quantity of studies about Big Data modeling is 2018. However, it is important to highlight that 2019 is ongoing and could ultimately have more studies than 2018;
- With 27 papers, Scopus is the source holding the highest number of relevant studies, followed by WoS and IEEE Xplore with two papers each. ScienceDirect does not report any relevant paper about the topic.
Table 3 summarizes the main data of each of the selected articles, among them, the reference, the first author name and affiliation, the country where the research was done, the identification of the journal or conference, the digital library, the publication year, the number of citations in Scopus, the knowledge application and the existence of funding.
Table 3. Bibliometric Analysis.
| First Author's Name | First Author's Affiliation | Country | Journal/Conference ID | Digital Library | Publication Year | Citations in Scopus | Knowledge Application | Funding |
|---|---|---|---|---|---|---|---|---|
| Jie Song | Software College, Northeastern | China | J1 | Scopus | 2019 | 0 | Academy | Yes |
| Laurent Thiry | University of Haute Alsace | France | J2 | Scopus | 2018 | 0 | Academy | NA |
| Victor Martins de Sousa | UNIFACCAMP | Brazil | C1 | Scopus | 2018 | 1 | Academy | Yes |
| Igor Zečević | University of Novi Sad | Serbia | J3 | Scopus | 2018 | 2 | Academy | Yes |
| Antonio M. Rinaldi | University of Naples Federico II | Italy | C2 | Scopus | 2018 | 1 | Academy | NA |
| Shady Hamouda | Emirates College of Technology | United Arab Emirates | C3 | Scopus | 2018 | 1 | Academy | NA |
| Dippy Aggarwal | University of Cincinnati | United States of America | J4 | Scopus | 2018 | 0 | Academy | NA |
| Alfonso de la Vega | University of Cantabria | Spain | C4 | Scopus | 2018 | 0 | Academy | Yes |
| Xu Chen | North Minzu University | China | J5 | Scopus | 2018 | 0 | Academy | NA |
| Maribel Yasmina Santos | University of Minho | Portugal | J6 | Scopus | 2017 | 10 | Academy | Yes |
| KwangchuShin | Kook Min University | South Korea | J7 | Scopus | 2017 | 7 | Academy | Yes |
| Fatma Abdelhedi | Toulouse Capitole University | France | C5 | Scopus | 2017 | 1 | Academy | NA |
| Aravind Mohan | Wayne State University | United States of America | C6 | Scopus | 2016 | 7 | Academy | Yes |
| Massimo Villari | University of Messina | Italy | C7 | Scopus | 2016 | 2 | Academy | NA |
| Maribel Yasmina Santos | University of Minho | Portugal | C8 | Scopus | 2016 | 10 | Academy | Yes |
| Maribel Yasmina Santos | University of Minho | Portugal | J8 | Scopus | 2016 | 8 | Academy | Yes |
| Ganesh B. Solanke | PCCoE, Nigdi | India | C9 | Scopus | 2018 | 0 | Academy | NA |
| Vincent Reniers | KU Leuven | Belgium | C10 | Scopus | 2018 | 0 | Academy | Yes |
| Fatma Abdelhedi | Toulouse Capitole University | France | C11 | Scopus | 2016 | 4 | Academy | NA |
| Max Chevalier | University of Toulouse | France | C12 | Scopus | 2016 | 6 | Academy | ANRT |
| Shreya Banerjee | National Institute of Technology | India | C13 | Scopus | 2015 | 6 | Academy | NA |
| Artem Chebotko | DataStax Inc. | United States of America | C14 | Scopus | 2015 | 43 | Industry | Yes |
| Wenduo Feng | Guangxi University | China | C15 | Scopus | 2015 | 2 | Academy | Yes |
| Ling Chen | Zhejiang University | China | C16 | Scopus | 2015 | 1 | Academy | Yes |
| Max Chevalier | University of Toulouse | France | C17 | Scopus | 2015 | 14 | Academy | NA |
| Dewi W. Wardani | Sebelas Maret University | Indonesia | C18 | Scopus | 2014 | 7 | Academy | NA |
| Ming Zhe | Hubei University of Technology | China | C19 | Scopus | 2013 | 0 | Academy | NA |
| Mohamed Nadjib Mami | University of Bonn | Germany | C20 | Scopus | 2016 | 5 | Academy | Yes |
| Dan Han | University of Alberta | Canada | C21 | WoS | 2013 | 0 | Academy | Yes |
| Zhiyun Zheng | Zhengzhou University | China | C22 | IEEE | 2014 | 1 | Academy | Yes |
| Dongqi Wei | University of Geosciences | China | C23 | IEEE | 2014 | 3 | Academy | NA |
| Karamjit Kaur | Thapar University | India | C24 | IEEE | 2013 | 59 | Academy | NA |
| Michael J. Mior | University of Waterloo | Canada | J1 | IEEE | 2017 | 12 | Academy | Yes |
| Max Chevalier | University of Toulouse | France | C25 | Scopus | 2016 | 4 | Academy | Yes |
| Harley Vera | University of Brasília | Brazil | C26 | Scopus | 2015 | 8 | Academy | NA |
| Robert T. Mason | Regis University | United States of America | C27 | NA | 2015 | 0 | Academy | NA |
3.1.1. Authors
In Figure 6, it is possible to verify the names of the first authors who have made major contributions to the subject. Thus, Maribel Yasmina Santos from Portugal and Max Chevalier from France occupy first place with three articles each and Fatma Abdelhedi from France is in second place with two articles. According to the observed data, two of Santos' studies were published in 2016 and another in 2017. Their research was performed in collaboration with University of Minho and it is the only one from Portugal presented in the final corpus of studies.
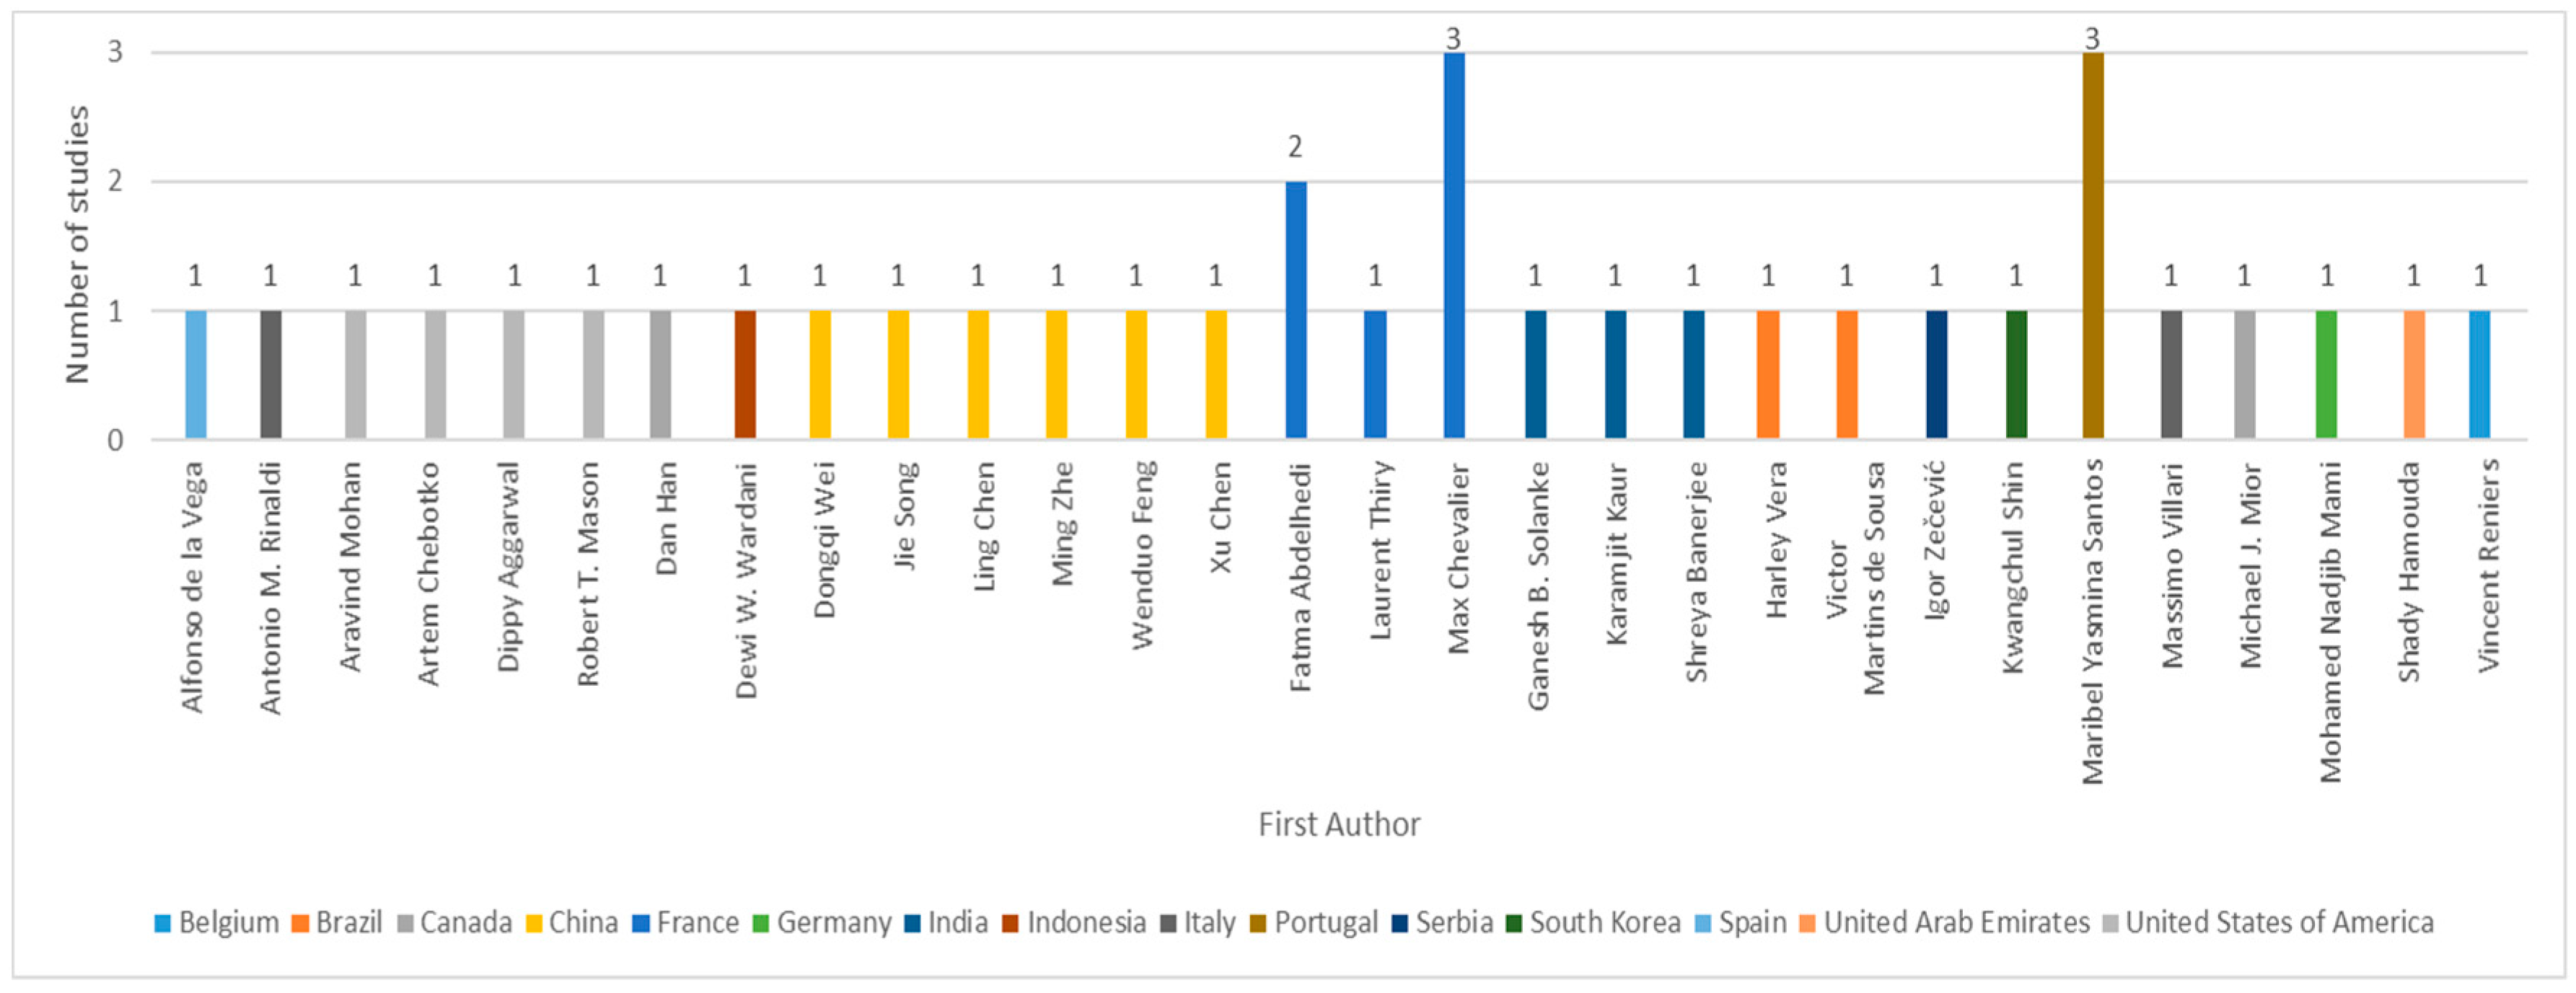
Figure 6. Contribution by author.
Regarding France, the authors Chevalier, Abdelhedi and Laurent Thiry investigated the topic and added six contributions in total, one published in 2015, 3 in 2016 and one in 2017 and 2018. Their research is linked to University of Haute Alsace and to University of Toulouse.
Countries such as the USA, China and India have made several contributions from different authors. For the USA there are four articles, in 2015 Robert Mason of the Regis University and Artem Chebotko from DataStax Inc. presented an article each, in 2016 Aravind Mohan from Wayne State University and in 2018, Dippy Aggarwal of the University of Cincinnati, also presented their approaches. In China, the six authors and institutions that have made contributions were, in 2013 Ming Zhe Hubei of the University of Technology, in 2014 Dongqi Wei from the University of Geosciences, in 2015 Ling Chen from Zhejiang University and Wenduo Feng of the Guangxi University, on 2018 Xu Chen University of the North Minzu and in 2019, Jie Song from the Software College, Northeastern. There are three studies from India published by Karamjit Kaur from Thapar University in 2013, Shreya Banerjee of the National Institute of Technology in 2015 and Ganesh Soanke from PCCoE, Nigdi in 2018.
In total, 15 different institutions, one from the industry and 14 from the academy have presented relevant works and it can be observed that even in 2018 and 2019 the subject is still being actively investigated.
3.1.2. Countries and Years
In this part, after discarding 16 duplicated results, 101 of the 117 articles collected after the inclusion stage were taken as sample. These articles contain research pertaining to our area of interest and allow us to analyze a greater number of articles.
Figure 7 shows that the leading countries in the topic of interest are the USA and China, with 17 and 16 articles, respectively. The country where Chevalier performed his research, France, takes third place with eight articles and, with seven publications each, Italy and Spain take the fourth spot. Finally, Germany takes fifth place with six studies.
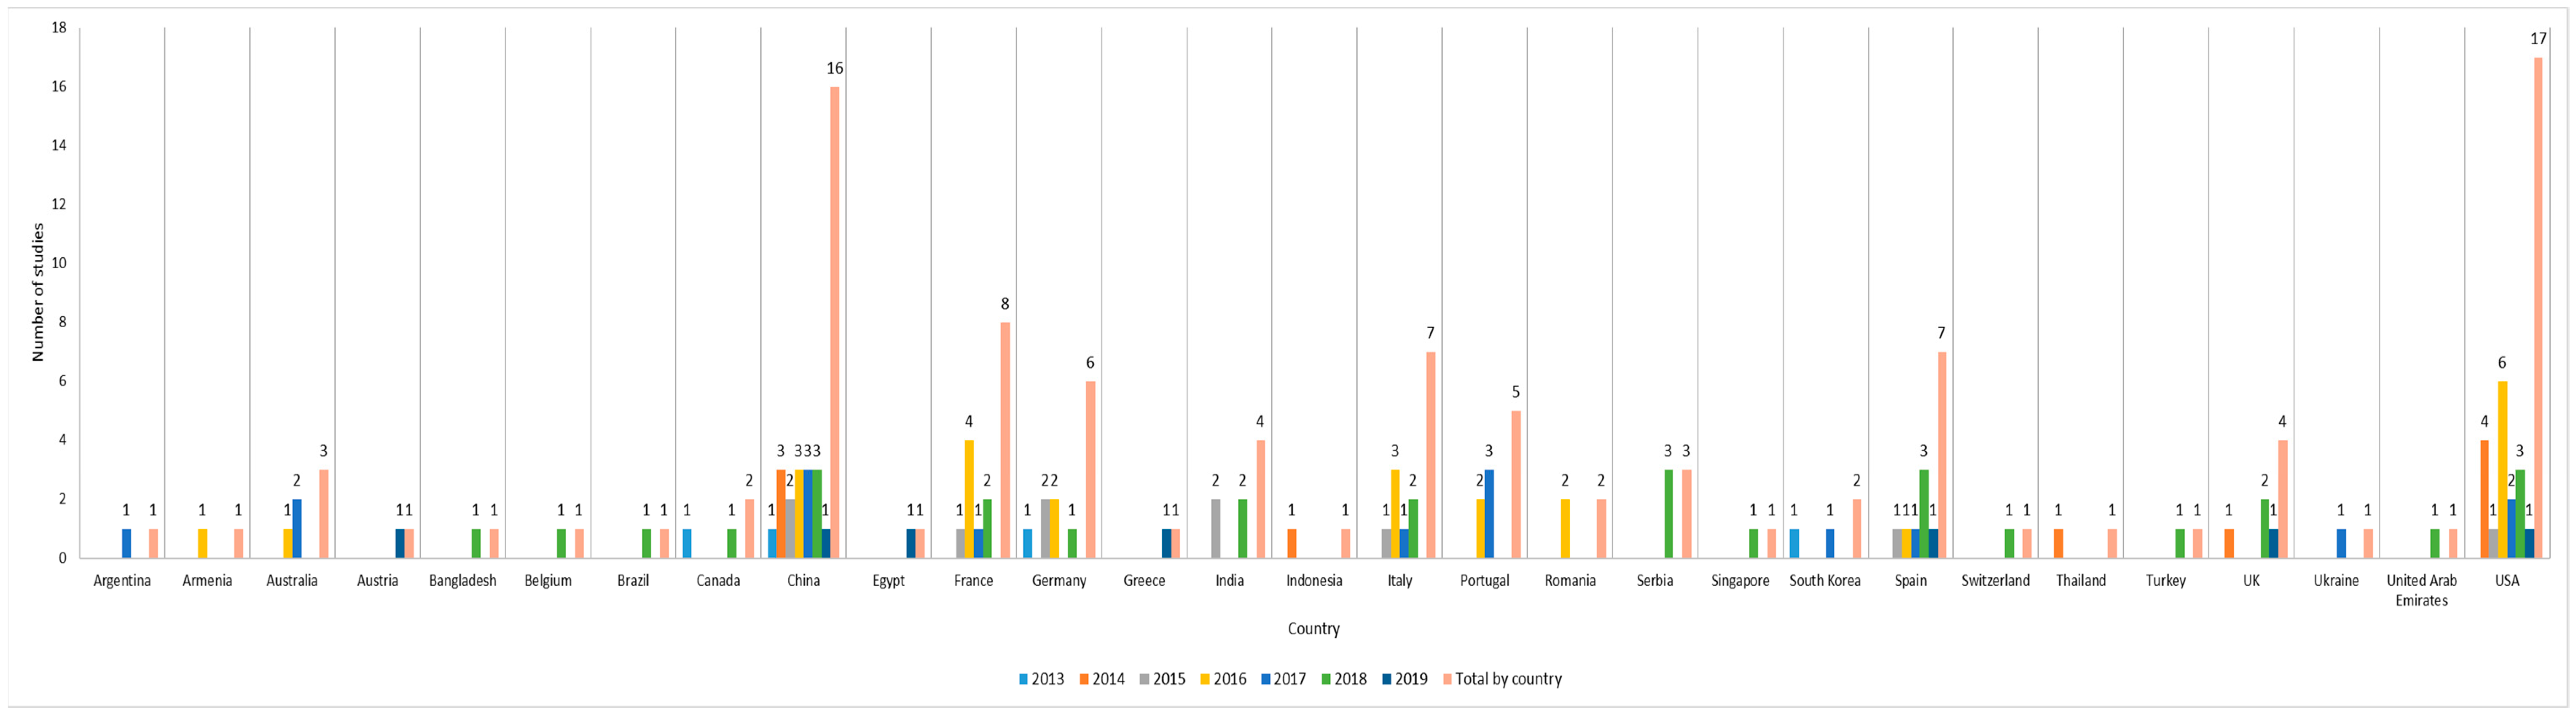
Figure 7. Contribution by year and country.
For the USA, four articles were published in 2014, one article in 2015, six articles in 2016, two articles in 2017, three articles in 2018 and one article in 2019. Therefore, the research in that country started in 2014, had the most contributions in 2016 and continues through 2019. Regarding China, their first article was published in 2013, followed by three articles in 2014, two articles in 2015, during 2016, 2017 and 2018 three articles in every year and one article in 2019. It can be seen that China initiated its research in 2013 and still continues to investigate the topic. It is also worth mentioning the constant article publications observed between 2014 and 2018. France started in 2015 with one article, four articles in 2016, one article in 2017 and two articles in 2018. This country started the research in 2015 and 2016 was the year with more contributions. Italy and Spain also started the research in 2015. Italy presented more articles during 2016 and Spain in 2018. Regarding 2019, only Spain has published one article. In 2013, Germany started the research with one article and its last published article was found in 2018.
As conclusion, from 2015 onwards, more countries start contributing to the scientific production on this topic, doubling the number of published articles in 2016. In 2018 and 2019, the trend remains. However, the year 2019 is still ongoing; therefore,
it is likely that many studies will be published before the end of the year.
3.1.3. Citations
Table 3 presents the number of citations of the studies in Scopus. Figure 8 presents the article with the greatest impact, which has 59 citations and was published by Karamjit Kaur from India, followed by one by Artem Chebotko from the USA, with 43 citations. It is important to highlight that both authors also belong to the countries with more contributions.
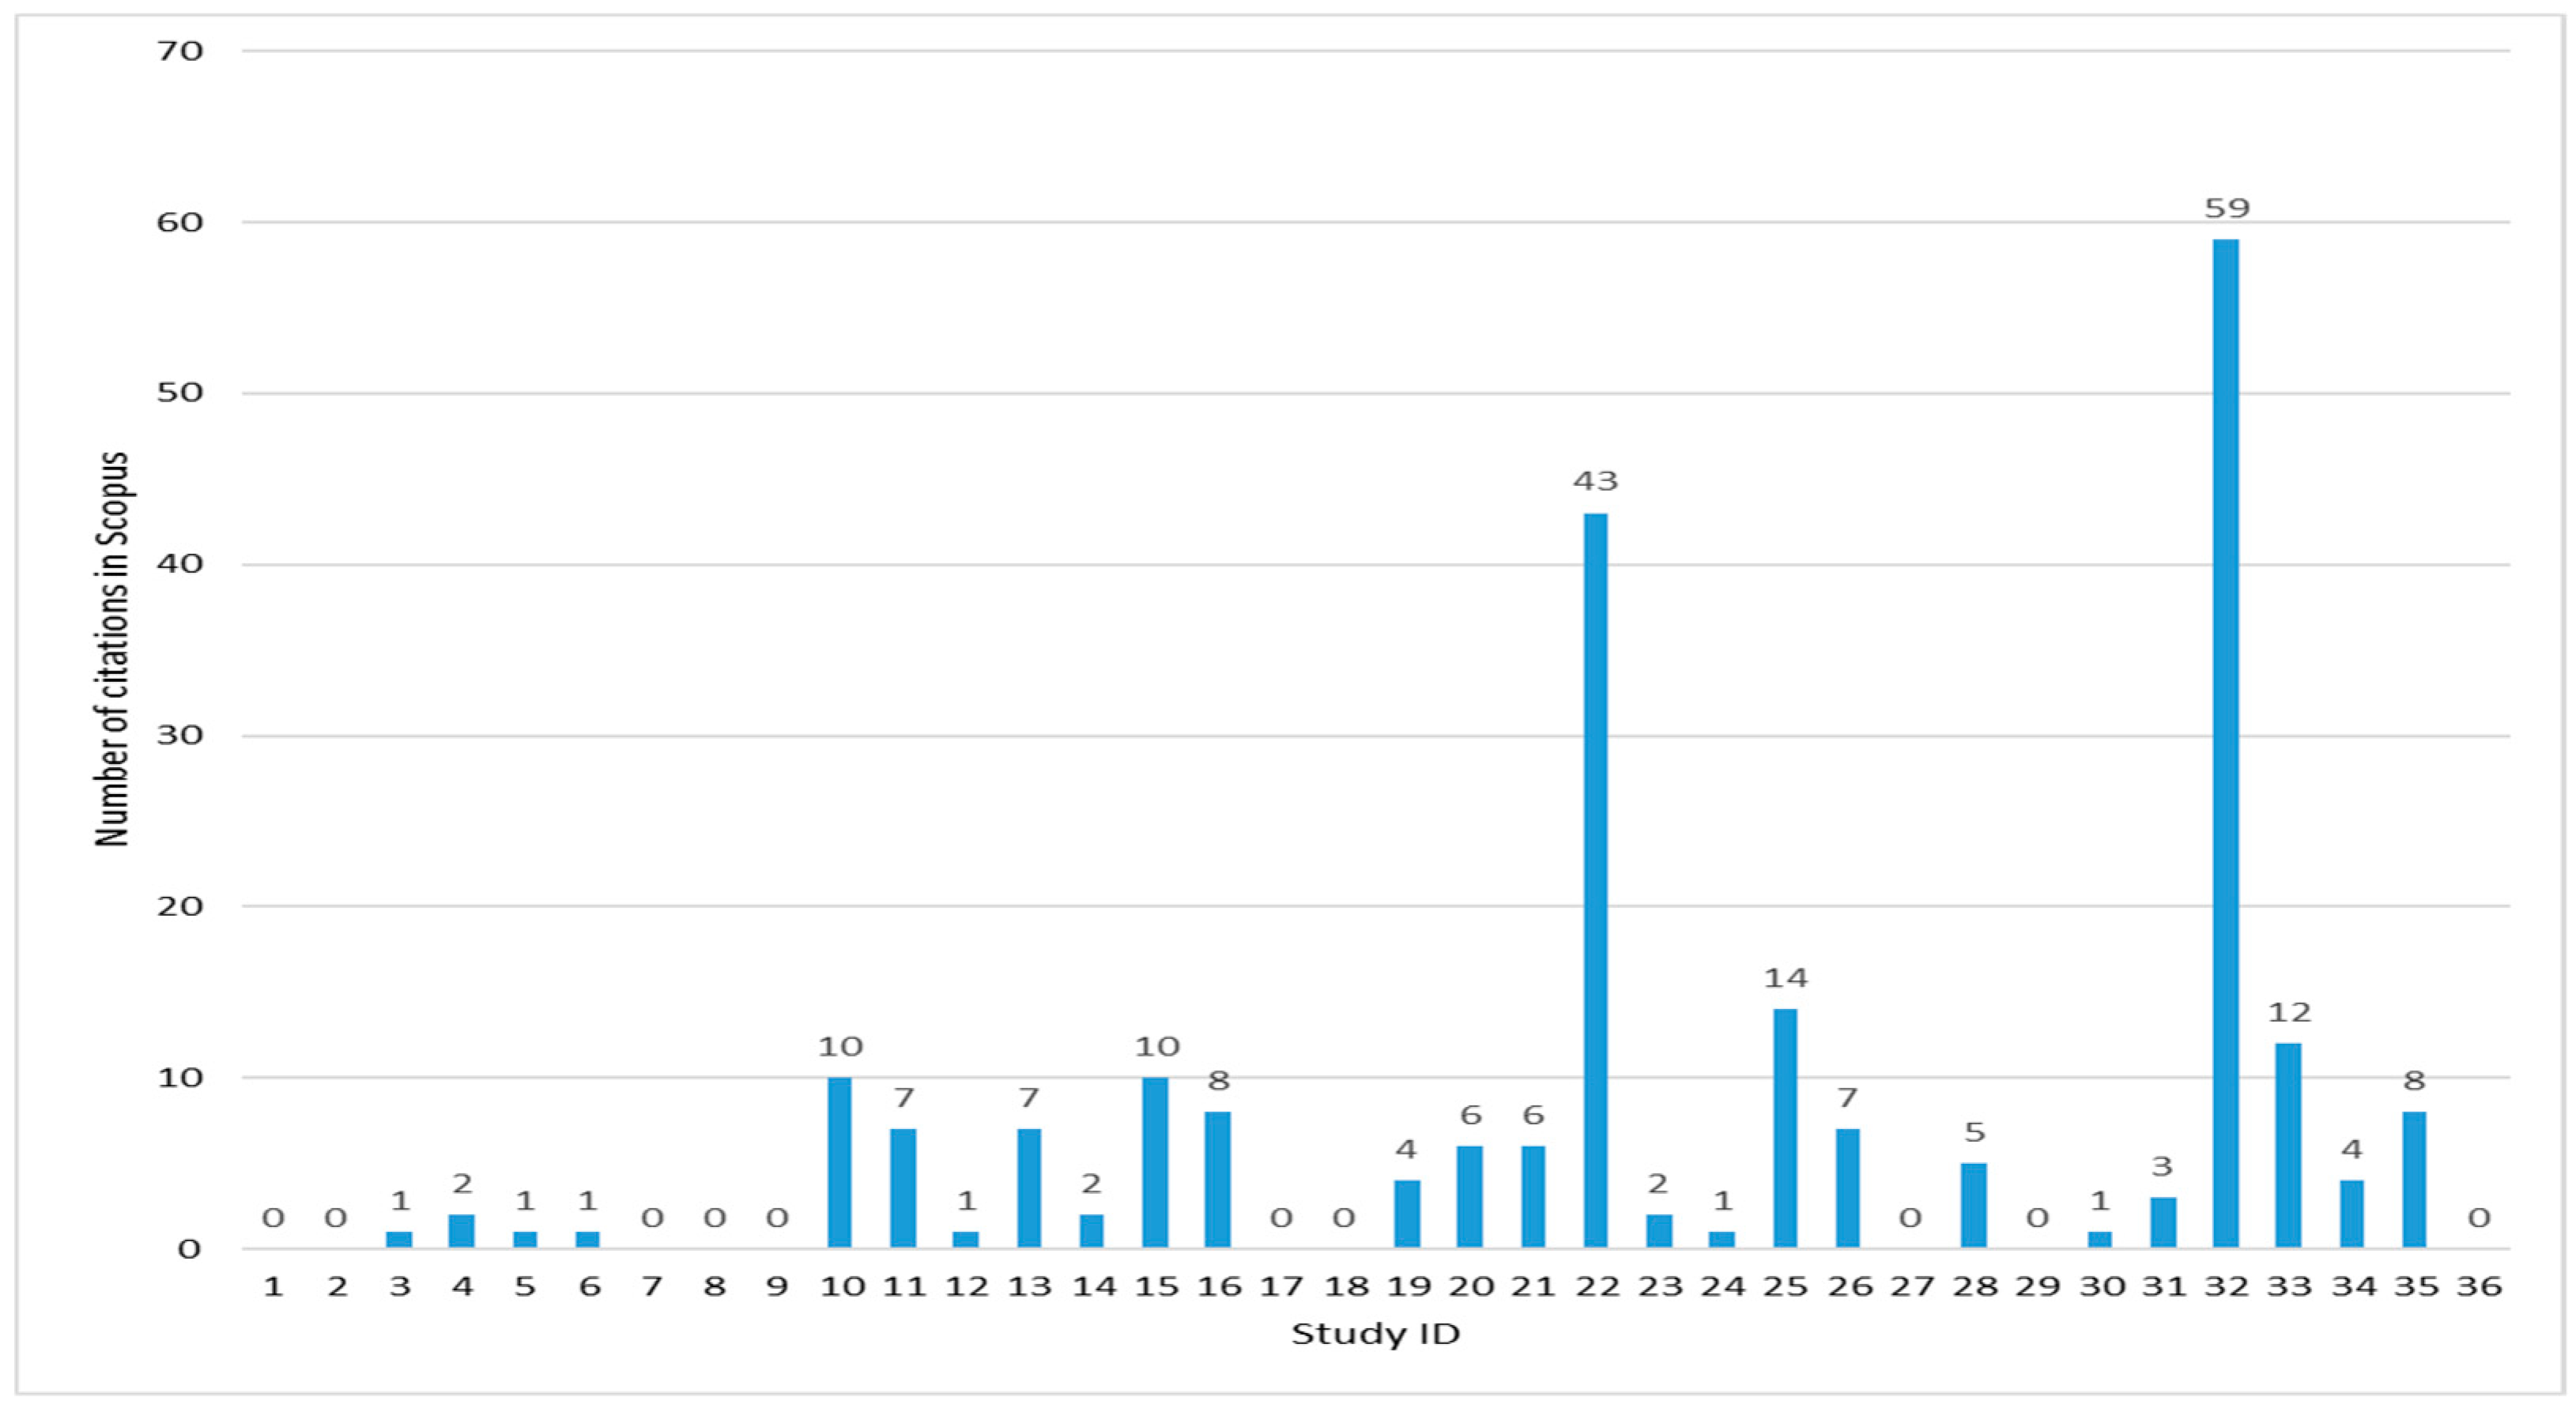
Figure 8. Number of citations in Scopus.
The most cited article has "Modeling and querying data in NoSQL databases" as a title and was published in 2013. The second most cited article is titled "A Big Data Modeling Methodology for Apache Cassandra" and was published in 2015. Further details
about these publications are presented in the SLR section.
It can also be noted, according to Table 3, that 97.22% of the articles belong to the academy and that 52.78% of the articles were funded. According to our criteria, this topic is considered of high relevance because funds are allocated in projects for research.
Table 4 and Table 5 provide information to the reader about the journals and conferences where the studies are published; their impact factor is also presented in the JCR and SJR, and, for the conferences, their ranking. It is important to highlight
that 75% of the studies were presented in conferences, thus we can anticipate that for the current year there are studies still under progress, that have not reached their final stage.
Table 4. Information of journals where the relevant studies were presented.
| Journal ID | Journal Name | Country | JCR IF | SJR | Study ID |
|---|---|---|---|---|---|
| J1 | IEEE Transaction on Knowledge and Data Engineering | United States of America | 3.86 | 1.1 | 1, 33 |
| J2 | Journal of Big Data | United Kingdom | NA | 1.1 | 2 |
| J3 | Enterprise Information Systems | United Kingdom | 2.12 | 0.7 | 4 |
| J4 | Advances in Intelligent Systems and Computing | Germany | NA | 0.2 | 7 |
| J5 | Filomat | Serbia | 0.79 | 0.4 | 9 |
| J6 | Journal of Management Analytics | United Kingdom | NA | NA | 10 |
| J7 | International Journal of Applied Engineering Research | India | NA | 0.1 | 11 |
| J8 | Lecture Notes in Computer Science | Germany | 0.4 | 0.3 | 16 |
Table 5. Information of conferences where the relevant studies were presented.
| Conference ID | Conference Name | CORE 2018 Ranking | Study ID |
|---|---|---|---|
| C1 | 20th International Conference on Information Integration and Web-Based Applications and Services | C | 3 |
| C2 | 10th International Conference on Management of Digital EcoSystems | Not ranked | 5 |
| C3 | 2017 International Conference on Big Data Innovations and Applications | Not ranked | 6 |
| C4 | 8th International Conference on Model and Data Engineering | Not ranked | 8 |
| C5 | 19th International Conference on Enterprise Information Systems | C | 12 |
| C6 | 5th IEEE International Congress on Big Data | Not ranked | 13 |
| C7 | 2016 IEEE Symposium on Computers and Communication | B | 14 |
| C8 | 9th International C* Conference on Computer Science and Software Engineering | Not ranked | 15 |
| C9 | 2017 International Conference on Computing, Communication, Control and Automation | Not ranked | 17 |
| C10 | 2017 IEEE International Conference on Big Data | Not ranked | 18 |
| C11 | 8th International Joint Conference on Knowledge Discovery, Knowledge Engineering and Knowledge Management | C | 19 |
| C12 | 18th International Conference on Enterprise Information Systems | C | 20 |
| C13 | 2015 IEEE International Conference on Industrial Informatics | Not ranked | 21 |
| C14 | 4th IEEE International Congress on Big Data | Not ranked | 22 |
| C15 | 2015 IEEE International Conference on Smart City/SocialCom/SustainCom together with DataCom | Not ranked | 23 |
| C16 | 2015 IEEE International Conference on Multimedia Big Data | Not ranked | 24 |
| C17 | 17th International Conference on Big Data Analytics and Knowledge Discovery | Not ranked | 25 |
| C18 | 2014 International Conference on Computer, Control, Informatics and Its Applications | Not ranked | 26 |
| C19 | 2013 International Conference on Computer Sciences and Applications | Not ranked | 27 |
| C20 | 18th International Conference on Big Data Analytics and Knowledge Discovery | Not ranked | 28 |
| C21 | 2013 IEEE Sixth International Conference on Cloud Computing | B | 29 |
| C22 | 3rd IEEE International Congress on Big Data | Not ranked | 30 |
| C23 | 2014 Fifth International Conference on Computing for Geospatial Research and Application | Not ranked | 31 |
| C24 | 2013 IEEE International Conference on Big Data | Not ranked | 32 |
| C25 | IEEE Tenth International Conference on Research Challenges in Information Science | B | 34 |
| C26 | 2nd Annual International Symposium on Information Management and Big Data | B | 35 |
| C27 | Informing Science & IT Education Conference | C | 36 |
3.1.4. Journals
We present in Table 4 the list of journals where the selected relevant studies were published. The table contains the assigned journal identifier, the journal name, the journal's country, the impact factor (IF) in the JCR and SJR and the related study ID. We considered it important to display the JCR IF and the SJR, since they are indicators related to the quality of the research according to the number of citations of the published studies and their importance in the scientific research.
3.1.5. Conferences
We present in Table 5 the details of the conferences where some relevant studies were presented. The assigned conference identifier, the conference name, the core ranking and the respective studies identifiers are listed. We used the conference
ranking Computing Research and Education Association of Australasia (CORE), 2018. This ranking was created by an association of computer science departments from universities in Australia and New Zealand. This Association provides conference
rankings in the computing disciplines based on a mix of indicators, including citation rates, paper submission and acceptance rates. The rankings range are represented by the letters A*, A, B and C - A* being the best and C the worst.
Through
the performed analysis, research question RQ1 is answered in significant detail. In order to answer the next two research questions, each of the selected articles deemed as relevant were analyzed, after a full reading of each of them.
3.2. Systematic Literature Review
The objective of this section is to answer the second research question, RQ2. To comply with this goal, we rely on the concept matrix compiled in Appendix A. There, we synthesize the literature about each one of the 36 articles that comprise the final
research corpus. Next, each of the key concepts that we have covered in this SLR will be described. Mainly, three domains are analyzed:
- Source
- Modeling
- Database
3.2.1. Source
At this section, we analyze the dataset sources and data types. The dataset sources enable us to know whether the research was carried out in a real-world environment or in a test environment with simulated data. The use of real-world datasets is important to verify compliance with the volume, velocity, veracity and value that characterizes Big Data. As mentioned in Section 1.1.4, according to a study, 90% of the existent data in the world corresponds to semi-structured and unstructured data. For this reason, this concept allows us to validate if the research is oriented to these types of data.
Data Set Sources
After analyzing the 36 selected articles, it was determined that 22 articles used sample datasets for their proposals, 10 articles used real-world datasets and four did not present any example of their solutions - for this reason they do not mention any type of dataset. Therefore, it was concluded that more than 50% of the relevant studies did not present their verified proposals with real-world datasets.
By not using real-world datasets, the behavior of the solutions in a production environment cannot be verified. The main real-world datasets used in the studies were sensor data, image metadata, websites publications and electronic documents, as Figure 9 presents. As we can see, those datasets are categorized as unstructured data that we analyze in the next concept. In addition, batch processing is used by most of these approaches, while real-time processing is proposed by one study about data modeling for commercial flights in the USA.

Figure 9. Types of used real-world data sets.
In Table 6, we summarize the ten studies with real-world data sets presented on Figure 9, in order to know under which application the studies were elaborated and whether they comply with the volume, velocity, veracity and value characteristics. The variety
characteristic is analyzed in the next subsection Data Types. From Table 6, we can see that 90% of the studies do not justify the velocity characteristic.
Table 6. Analysis of real-world data sets used in the relevant studies.
| Real-World Data Sets | Study ID | Domain | Volume | Velocity | Veracity | Value |
|---|---|---|---|---|---|---|
| Electronic documents | 27 | e-government electronic documents | A large number of e-government electronic documents | Not available | Documents are laws and regulations | Managing housing transfer process |
| Images metadata | 5 | Images from a web server | Network with 8000 relationships and 5990 nodes | Not available | Knowledge base of famous painters | Obtaining images related to the famous painters |
| Sensors | 9 | Fuzzy spatio-temporal data | Not available | Not available | Data from the real movement of the tropical cyclones Saomei and Bopha under the influence of subtropical high | Analyzing meteorological phenomena |
| 13 | Vehicles into OpenXC | 14 exabytes per year | Up to 5GB/hour | Data from devices that are installed in the vehicles | Providing insights on the risk level based on the drivers driving behavior | |
| Websites | 4 | Web-based agriculture application | Not available | Not available | Data from a Precision Agriculture Based Information Service (PAIS) application | Providing an online service to the farmers, with 24/7 access to the images of the crops |
| 10 | Commercial flights in the USA | More than 123 million records | Not available | Domestic flights in the USA obtained from RITA-BTS | Presenting the behavior of the companies regarding to the accomplished and cancelled flights | |
| 18 | Review site Epinions | Not available | Not available | Data from online consumers | Identifying the user preferences | |
| 30 | Microblog SINA | 1.75 GB | Not available | Data from 1500 user profiles and their microblogs | Not available | |
| 32 | Slashdot | Not available | Not available | User posts | Finding useful information about the user posts | |
| 33 | EasyAntiCheat | Large volumes from real-time data of players behavior | Not available | Partial workload extracted from multiplayer games | Determine patterns for cheating detection |
Data Types
In this respect, 18 studies from the relevant articles present solutions for unstructured data and 12 articles for semi-structured data. According to those data, it is possible to verify that the research about the modeling of unstructured and semi-structured data follows current trends 83.33% of the time.
Another interesting fact is that there are also studies that propose modeling approaches for structured data. This is because, for the data to be considered as Big Data, they must also comply with the variety characteristic. These structured data are
analyzed in eight studies and come from relational databases.
3.2.2. Modeling
In this section, from the final corpus selected, we analyzed the proposed data abstraction levels, the models presented at the conceptual, logical and physical levels, the proposed approaches for transformation between abstraction levels, the modeling
language, methodology and tools.
Data Abstraction Levels
For this concept, we intend to determine what levels of data abstraction have been covered by the studies for data modeling solutions. As mentioned in the Big Data Concepts subsection, there are three levels used for relational databases that are also used in NoSQL stores: conceptual, logical and physical. According to Figure 10, which summarizes the data obtained in Appendix A from the 36 studies, 25 present approaches for data modeling at the three levels of abstraction, therefore, those studies can be considered as complete works that reached the physical implementation of their proposals in a NoSQL storage. The other studies only cover one or two levels although it is possible that, in the future, their works will demonstrate their approaches at all three levels.
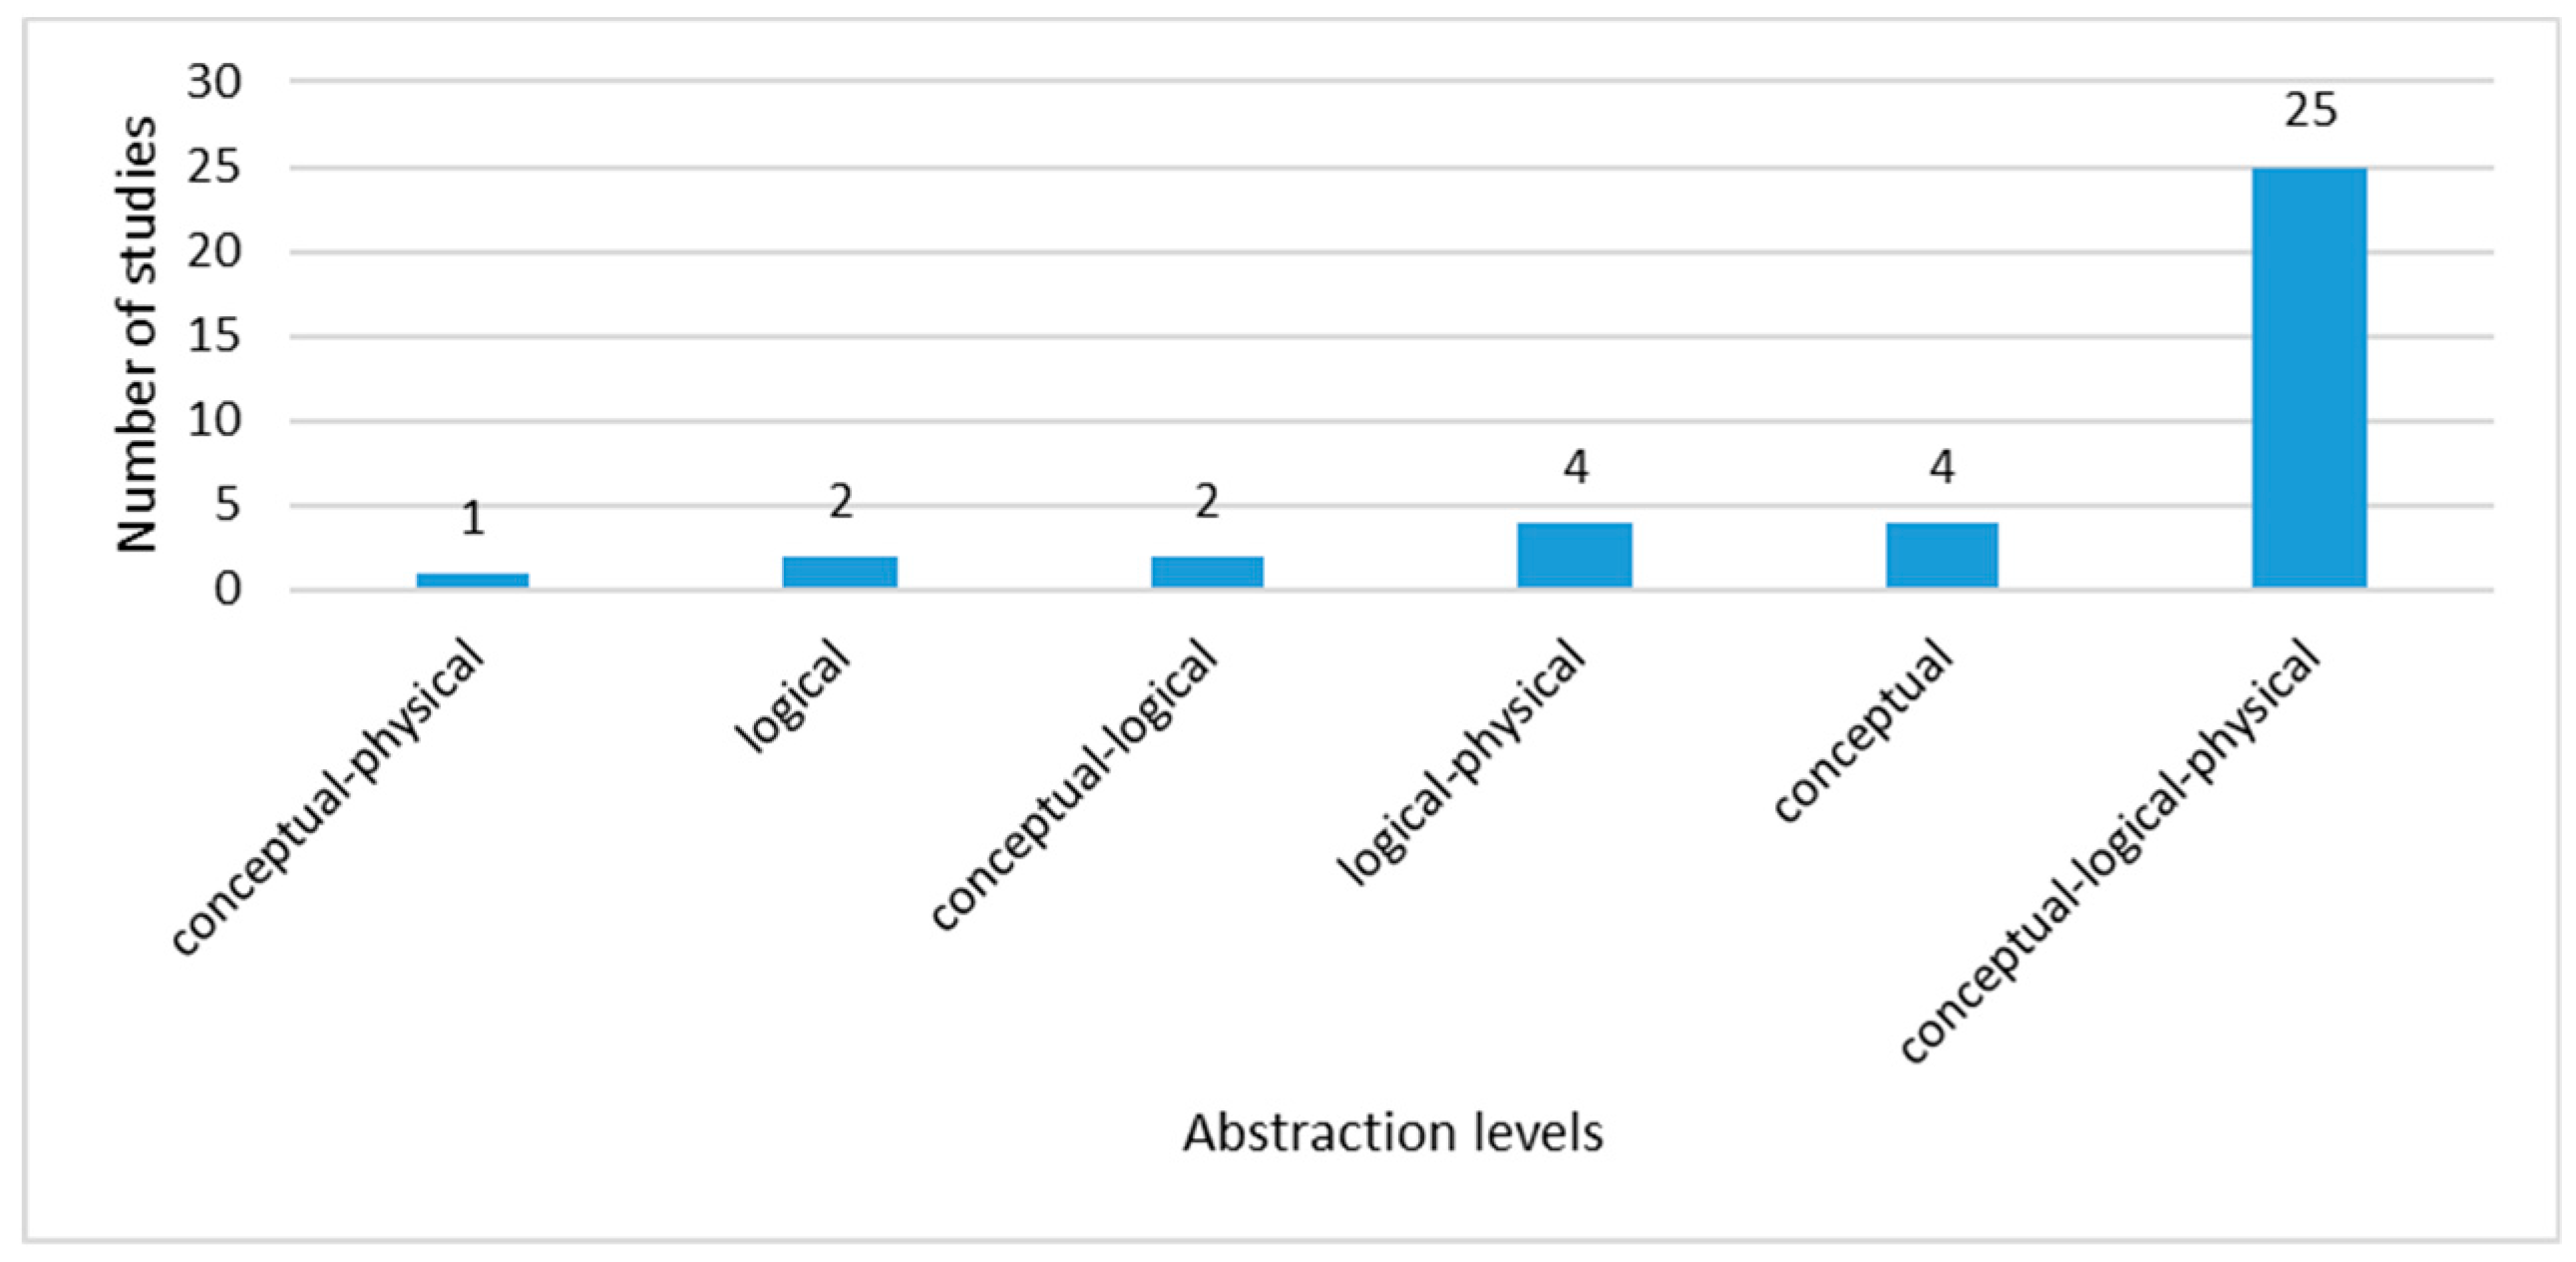
Figure 10. Data Abstraction Levels for modeling Big Data.
The next concept presents the data model proposed by authors for each data abstraction level.
Data Model at Conceptual Level
This concept comprises the models presented in each study from the final corpus at the conceptual abstraction level. As we mentioned before, this level is technology-agnostic and there is no restriction regarding the use of well-known models applied to relational databases.
Figure 11 presents 19 works using the ER model at the conceptual abstraction level. Within these 19 works, one proposes the use of Extended Binary Entity Relationship (EBER), an ER-based model that adopts different types of attributes and a dominant role. Another study from the 19 works, proposes Enriched Entity Relationship (EER) with graphic notation for the representation of Big Data.
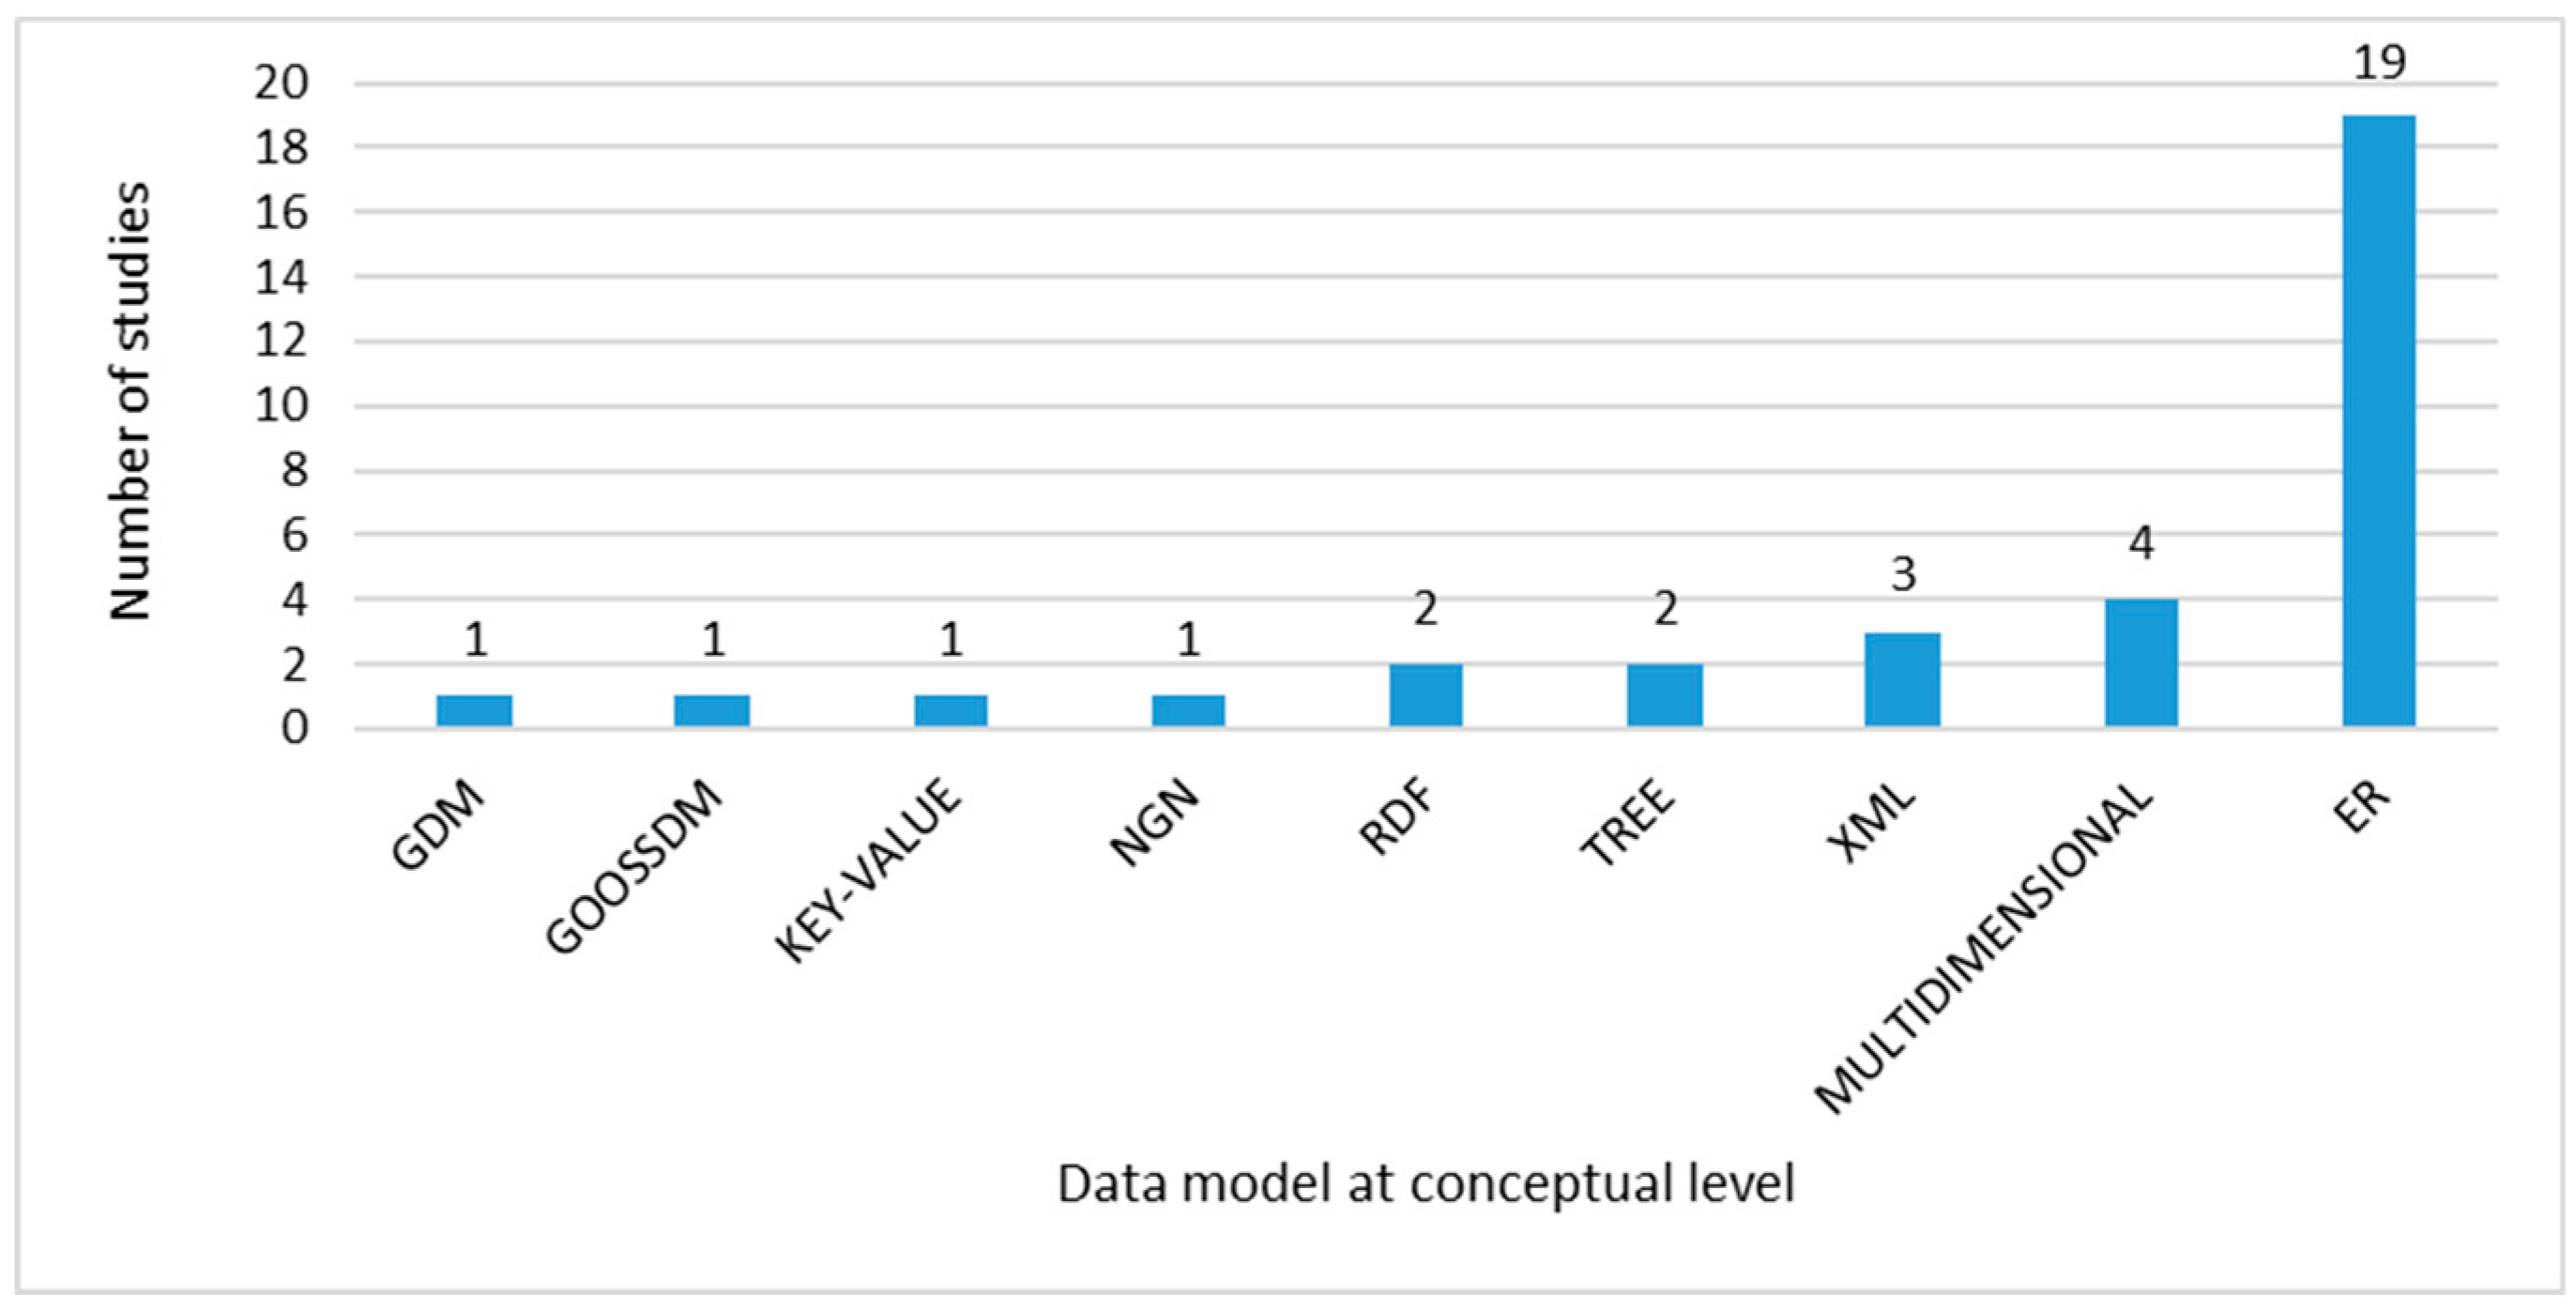
Figure 11. Data Model at conceptual abstraction level.
Furthermore, the use of the multidimensional data model is observed in four studies. It is assumed that this is derived from the increasing interest in DataWarehouses and DataMarts for Online Analytical Processing (OLAP), where the usage of ad-hoc
queries is common. In addition, three papers propose the use of the XML model, which corresponds to an abstract representation of XML fragments. The other eight remaining works propose independent models, such as the Generic Data Model (GDM),
the Graph Object Oriented Semi-Structured Data Model (GOOSSDM), Key-value, Novel Graphical Notation (NGN), Resource Description Framework (RDF), Tree and there are two works that do not propose any model.
Data Model at Logical Level
At the level of logical abstraction, according to the data obtained in Figure 12, the trend model is document-oriented with 12 studies, followed by graph-oriented and column-oriented, with seven studies each. As detailed in the Big Data Concepts subsection, there are four widely used models in NoSQL key-value: column-oriented, document-oriented and graph; however, key-value has been studied at this level of abstraction in just one proposal.
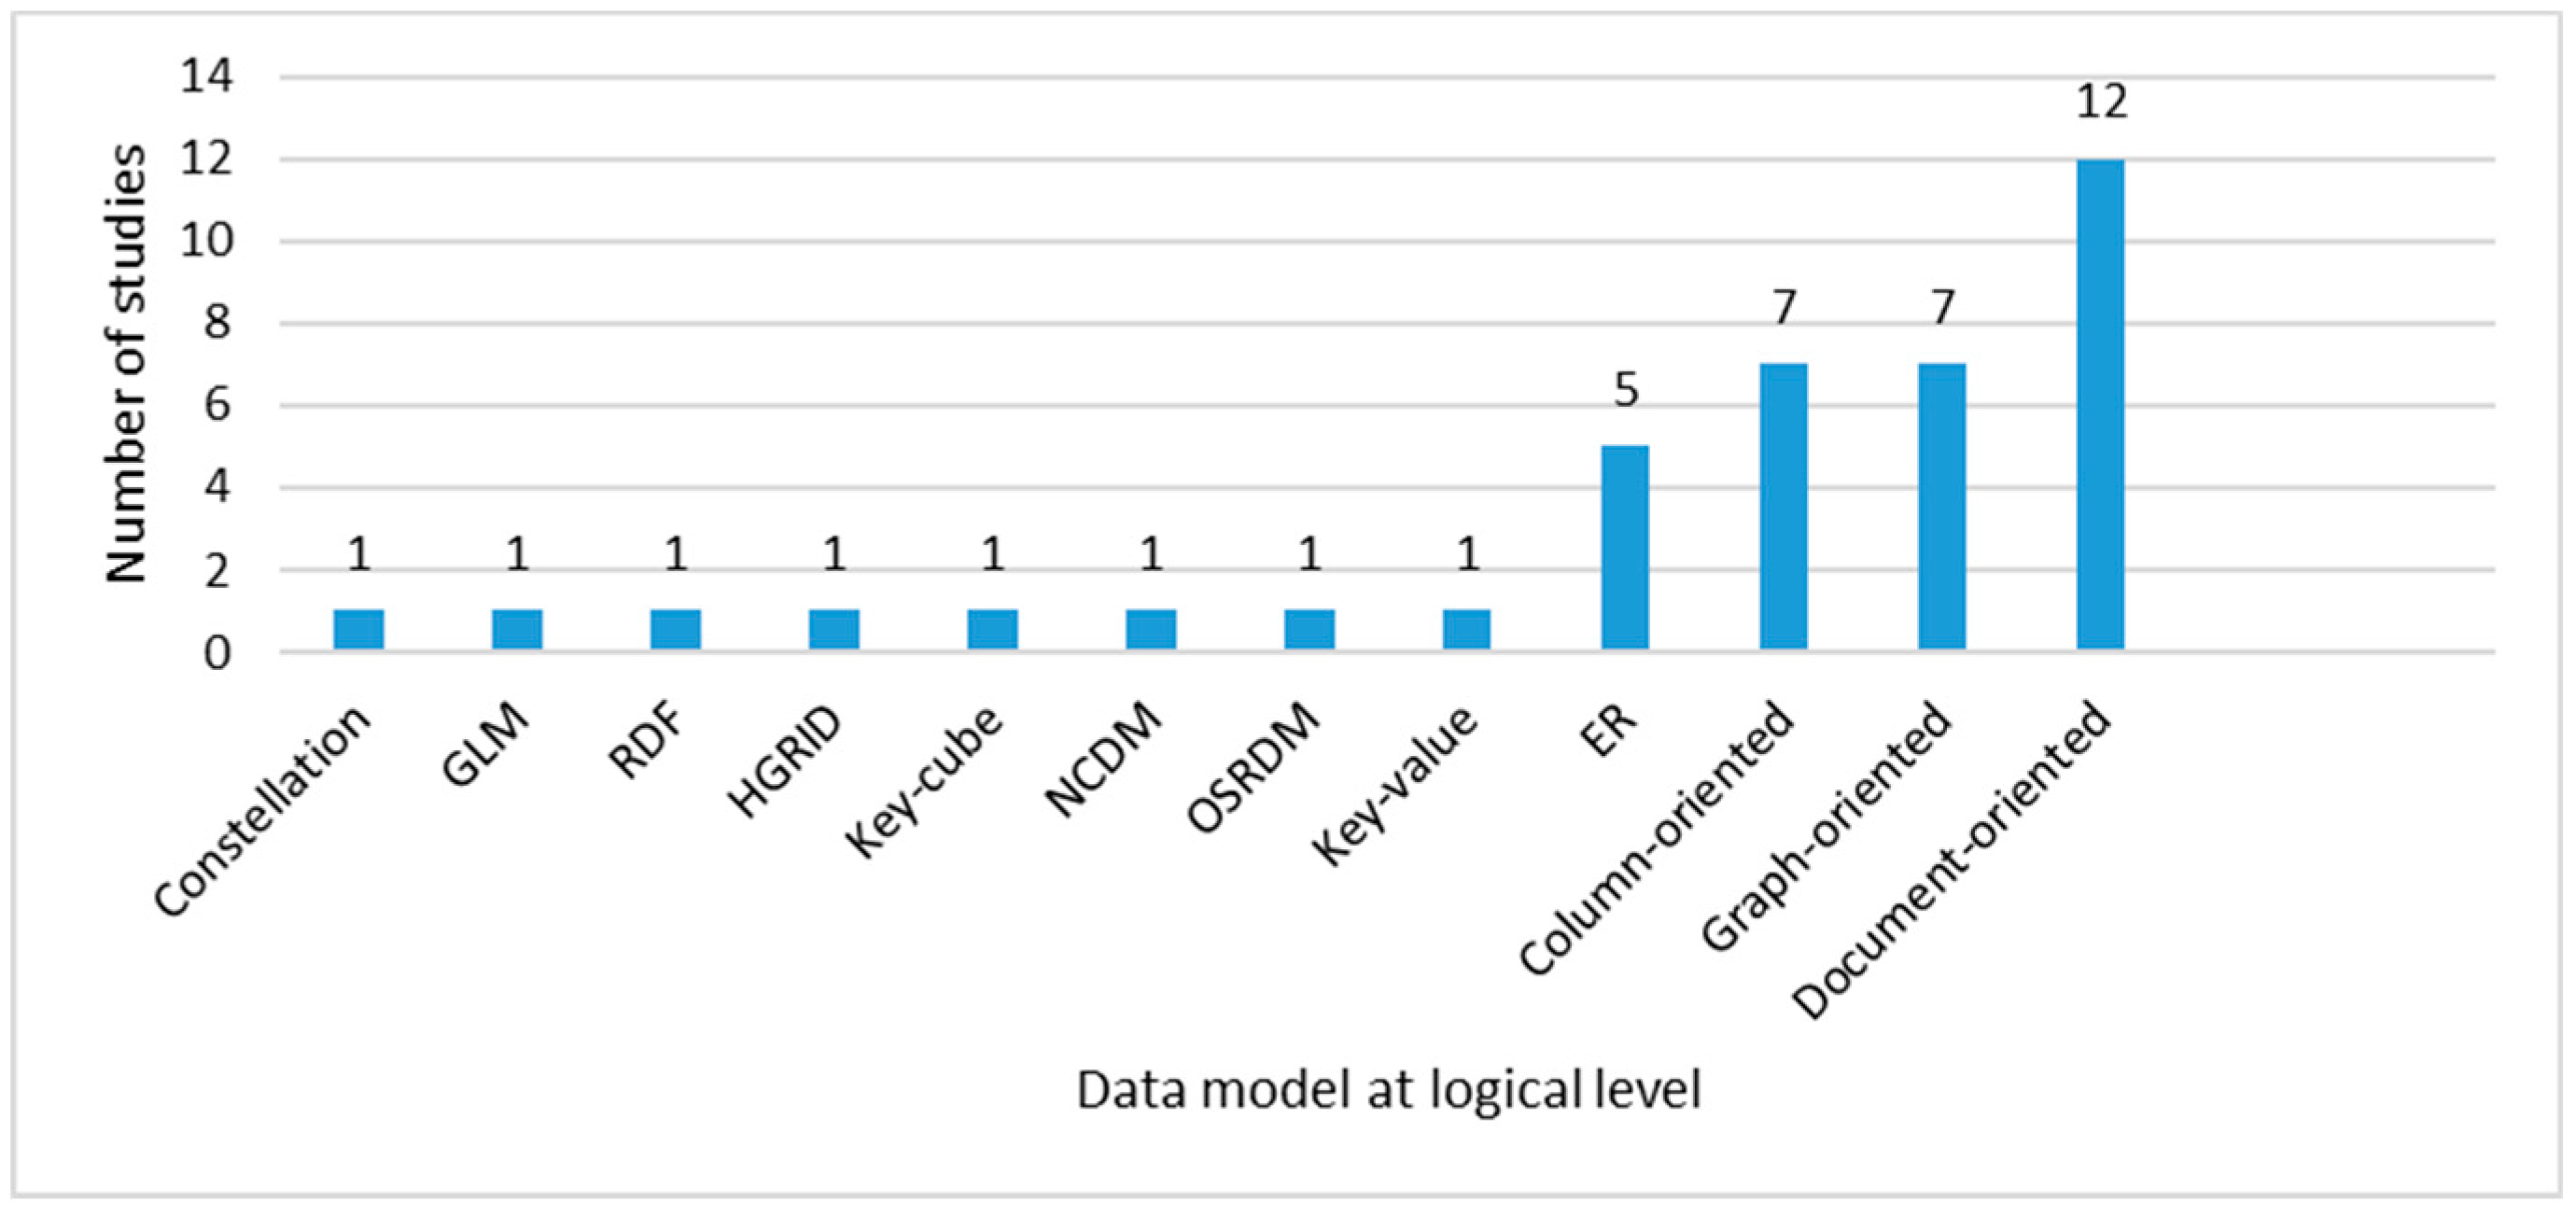
Figure 12. Data Model at logical abstraction level.
ER has also been proposed as a logical level model in three studies and the eight remaining studies have proposed independent solutions such as Constellation, Generic Logical Model (GLM), RDF, HGrid, NoSQL Collectional Data Model (NCDM), Open Scalable Relational Data Mode (OSRDM) and Key-cube. In addition, five studies do not propose any model at this level.
The data obtained in this section will be compared with the data from the following one, which determines the most studied data stores' implementations from the selected relevant articles.
Data Model at Physical Level
At this level, the physical implementations of the models in a specific DBMS are determined. According to the results obtained in Figure 13, the trend is towards the implementation in MongoDB with 13 proposals, followed by Neo4j with seven studies and, finally, Cassandra with six studies. These data match with the data presented in Figure 12, where the trend at the logical level is towards document-oriented, column-oriented and graph-oriented models.
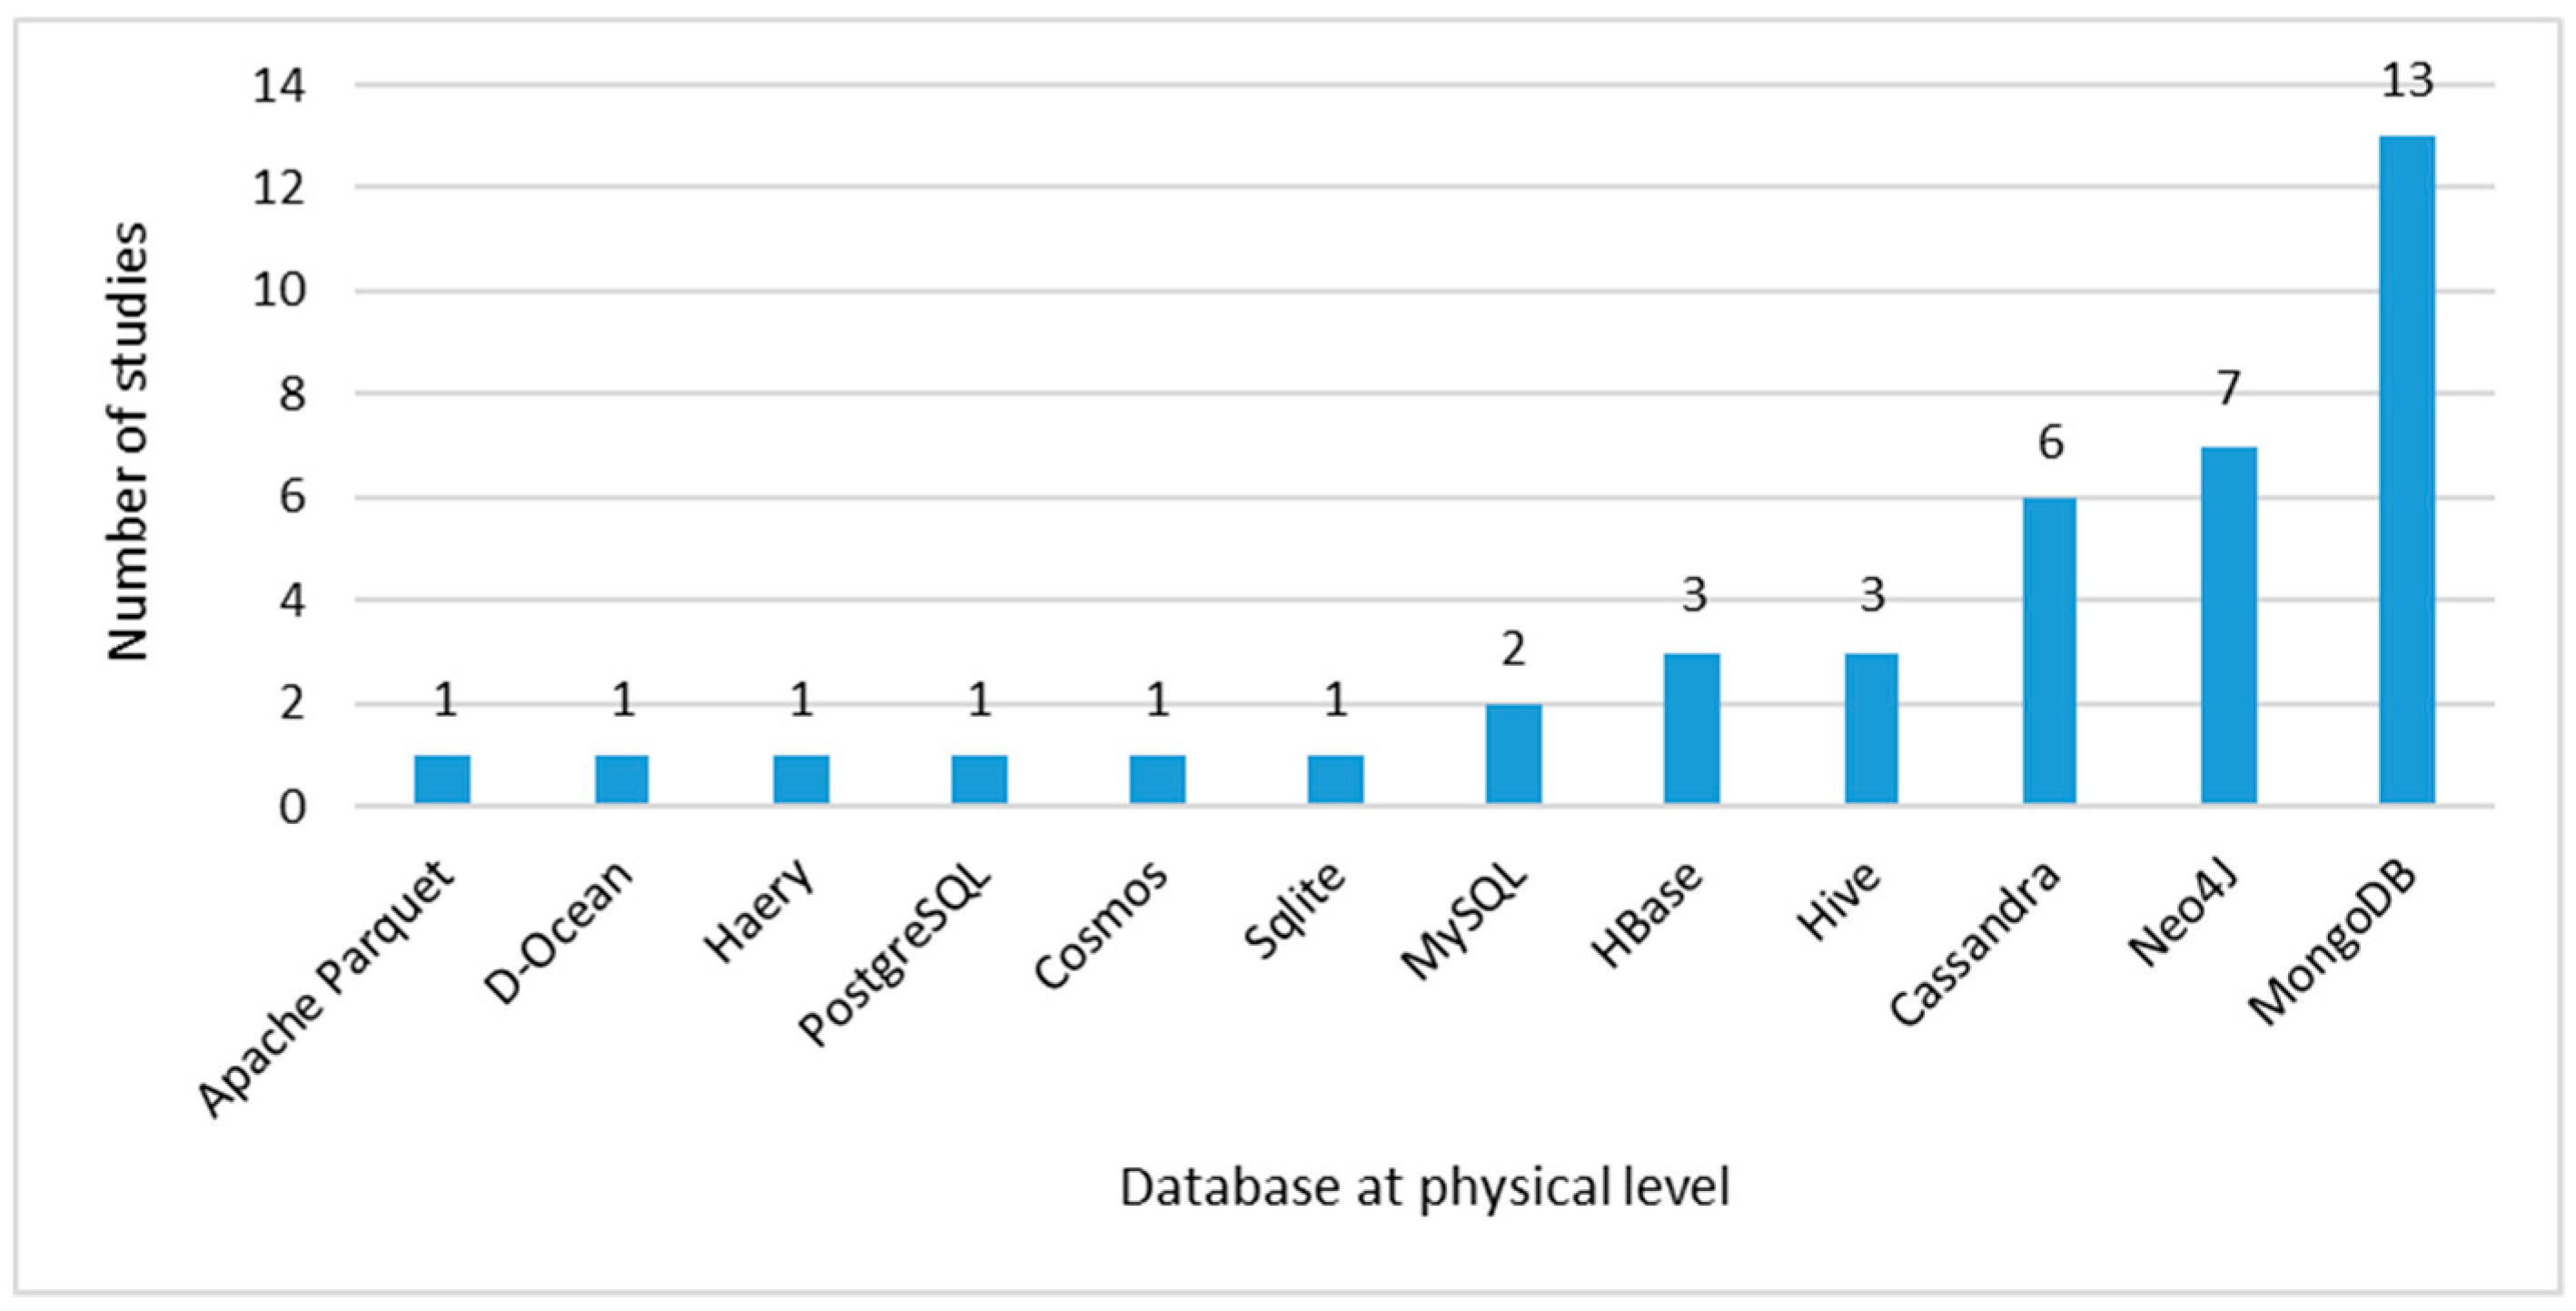
Figure 13. Data Model at physical abstraction level.
MongoDB is a document-oriented NoSQL DBMS that stores data in JSON. Each document has its own unique identifier, which is used as a primary key. This DBMS is used by FourSquare, SourceForge, CERN and the European Organization for Nuclear Research, among other companies.
Neo4j is a graph-oriented NoSQL DBMS that organizes its data via labels for grouping nodes and edges, also called relationships and both nodes and edges can have properties in the form of key-value pairs. This DBMS is especially used by Infojobs, a private company for job searches.
Cassandra is a column-oriented NoSQL DBMS that represents the data in a tabular form by columns and rows. Big companies, such as Facebook and Twitter, use this DBMS.
We perceive that MongoDB is the most studied DBMS because large companies use it, probably because of its characteristics of support for aggregation and secondary indexes query operations and the consistency and partitioning tolerance mentioned in the Big Data Concepts subsection. Furthermore, these are open source databases with highly scalable, flexible and best performance compared with relational databases. These results give us the idea of a trend in each of the known data models - document-oriented - with MongoDB, column-oriented with Cassandra and graph with Neo4j.
There are also implementations of NoSQL HBase and Hive DBMS on a smaller scale and relational databases, of which PostgreSQL and MySQL are among the best-known. It is worth mentioning that there are studies that propose hybrid solutions with implementations that include different databases. More details about these studies will be presented in the Database section.
In summary, most studies propose the use of the ER model at the conceptual level, a document-oriented model at the logical level and the implementation of MongoDB at the physical level.
Transformation between Abstraction Levels
According to Figure 10, there are 25 selected studies that present their approaches at the three abstraction levels and eight studies at two levels differentiated from logical to physical, conceptual to logical and conceptual to physical. According to this concept, the proposed approaches for the transformation between the data abstraction levels are presented.
As presented in Figure 14, there are 19 studies where the authors propose their own novel mapping rules, which demonstrates the separate research that exists on this topic. Thus, it is difficult to decide which is the most appropriate when selecting any of them. Another interesting aspect is that 12 studies do not define transformation rules and there are six studies that propose transformations based on other techniques, such as the Linearization Algorithm (LA), ATL Transformation Language (ATL), Hoberman Heuristic (HH), Algorithm Cardinality (AC), Category Theory (CT) and Workload Space Constraint (WSC).
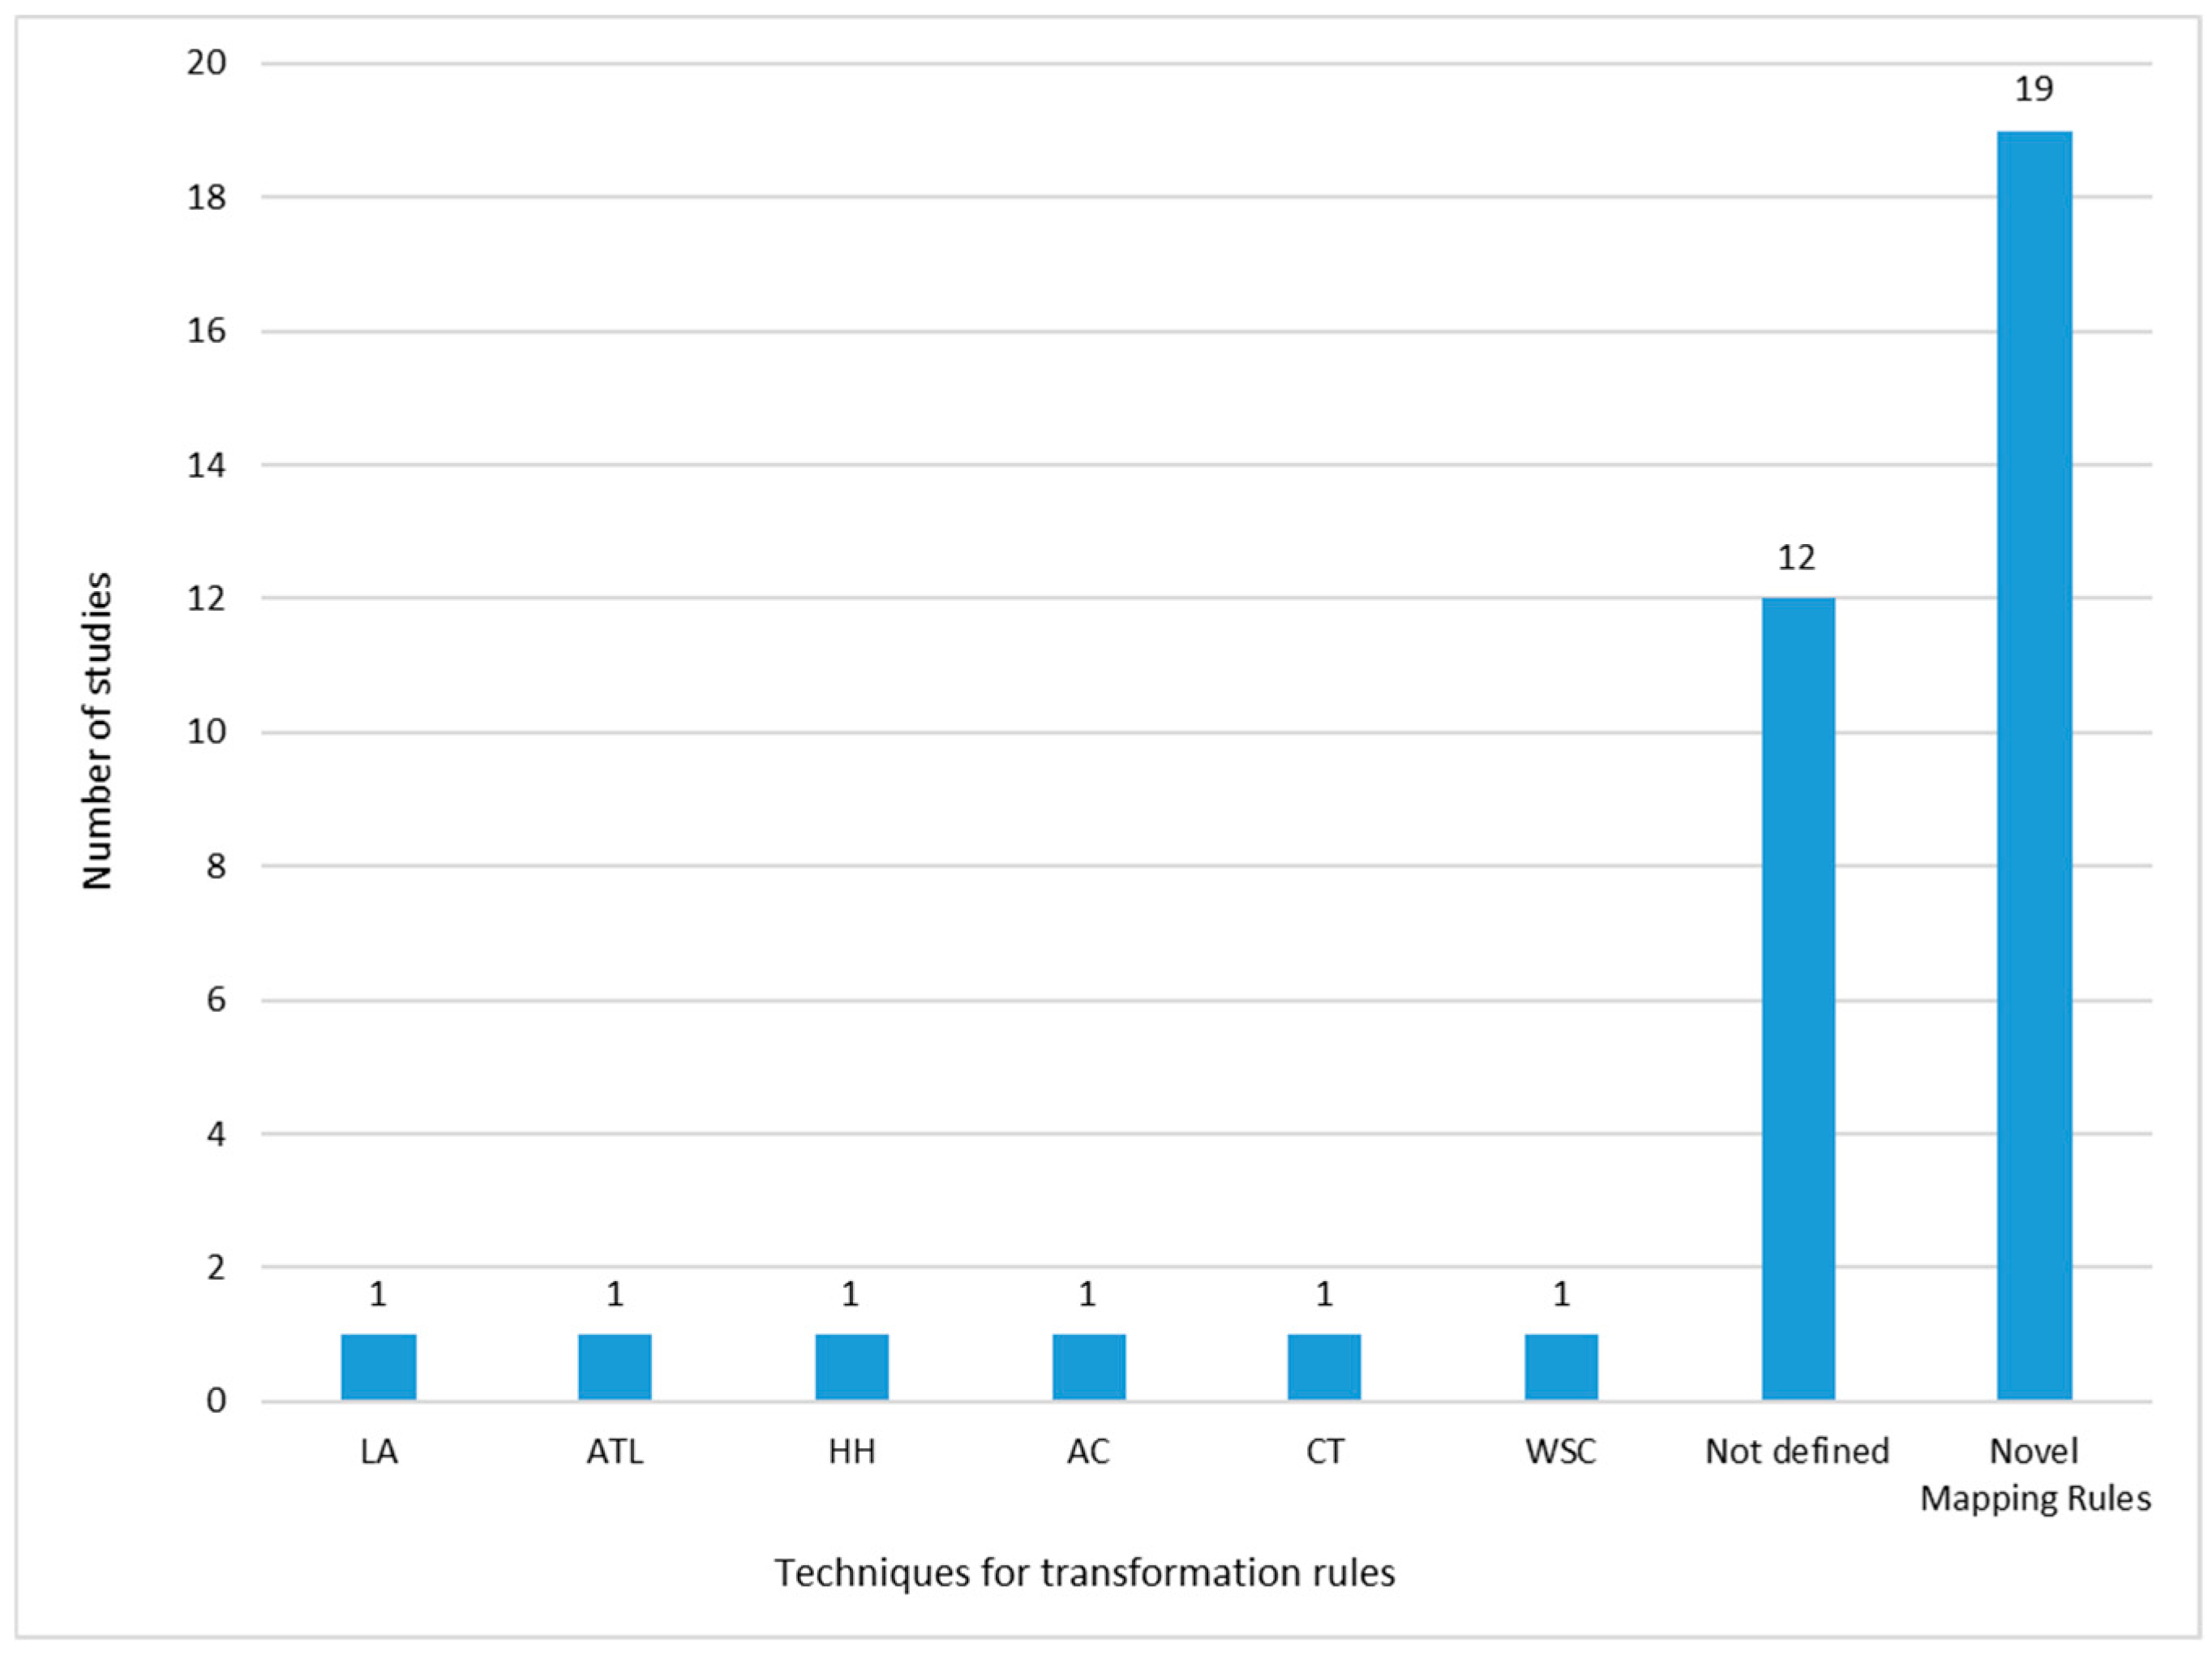
Figure 14. Transformation between data abstraction levels.
In general, the authors propose the below algorithm that takes a model as input, apply their own transformation rules and produce another model as output:
Input1: Conceptual Level:  , where
  belongs to each
  element from conceptual model.
Transformation rules:  , where
  belongs to each
  rule or
constraint from mapping rules defined by the authors.
rule or
constraint from mapping rules defined by the authors.
Output1: Logical Level:  , where
  belongs to each
  element from logical model.
Input2 = Output 1
Transformation rules':
 , where
  belongs to each rule or constraint from mapping rules defined by the authors.
Output2: Physical Level:  , where
  belongs to each element from physical
model.
belongs to each element from physical
model.
Modeling Language
In this concept, it is important to clarify that a data model describes the characteristics of the data, its structure, its operations and its constraints; meanwhile, data modeling is the process of generating these models. The purpose of data modeling is for models to be used and understood by all modelers, developers and other persons working in the software development/engineering area in a standardized way. Thus, Figure 15 presents the results obtained from the mapping performed in Appendix A from the selected 36 relevant papers.
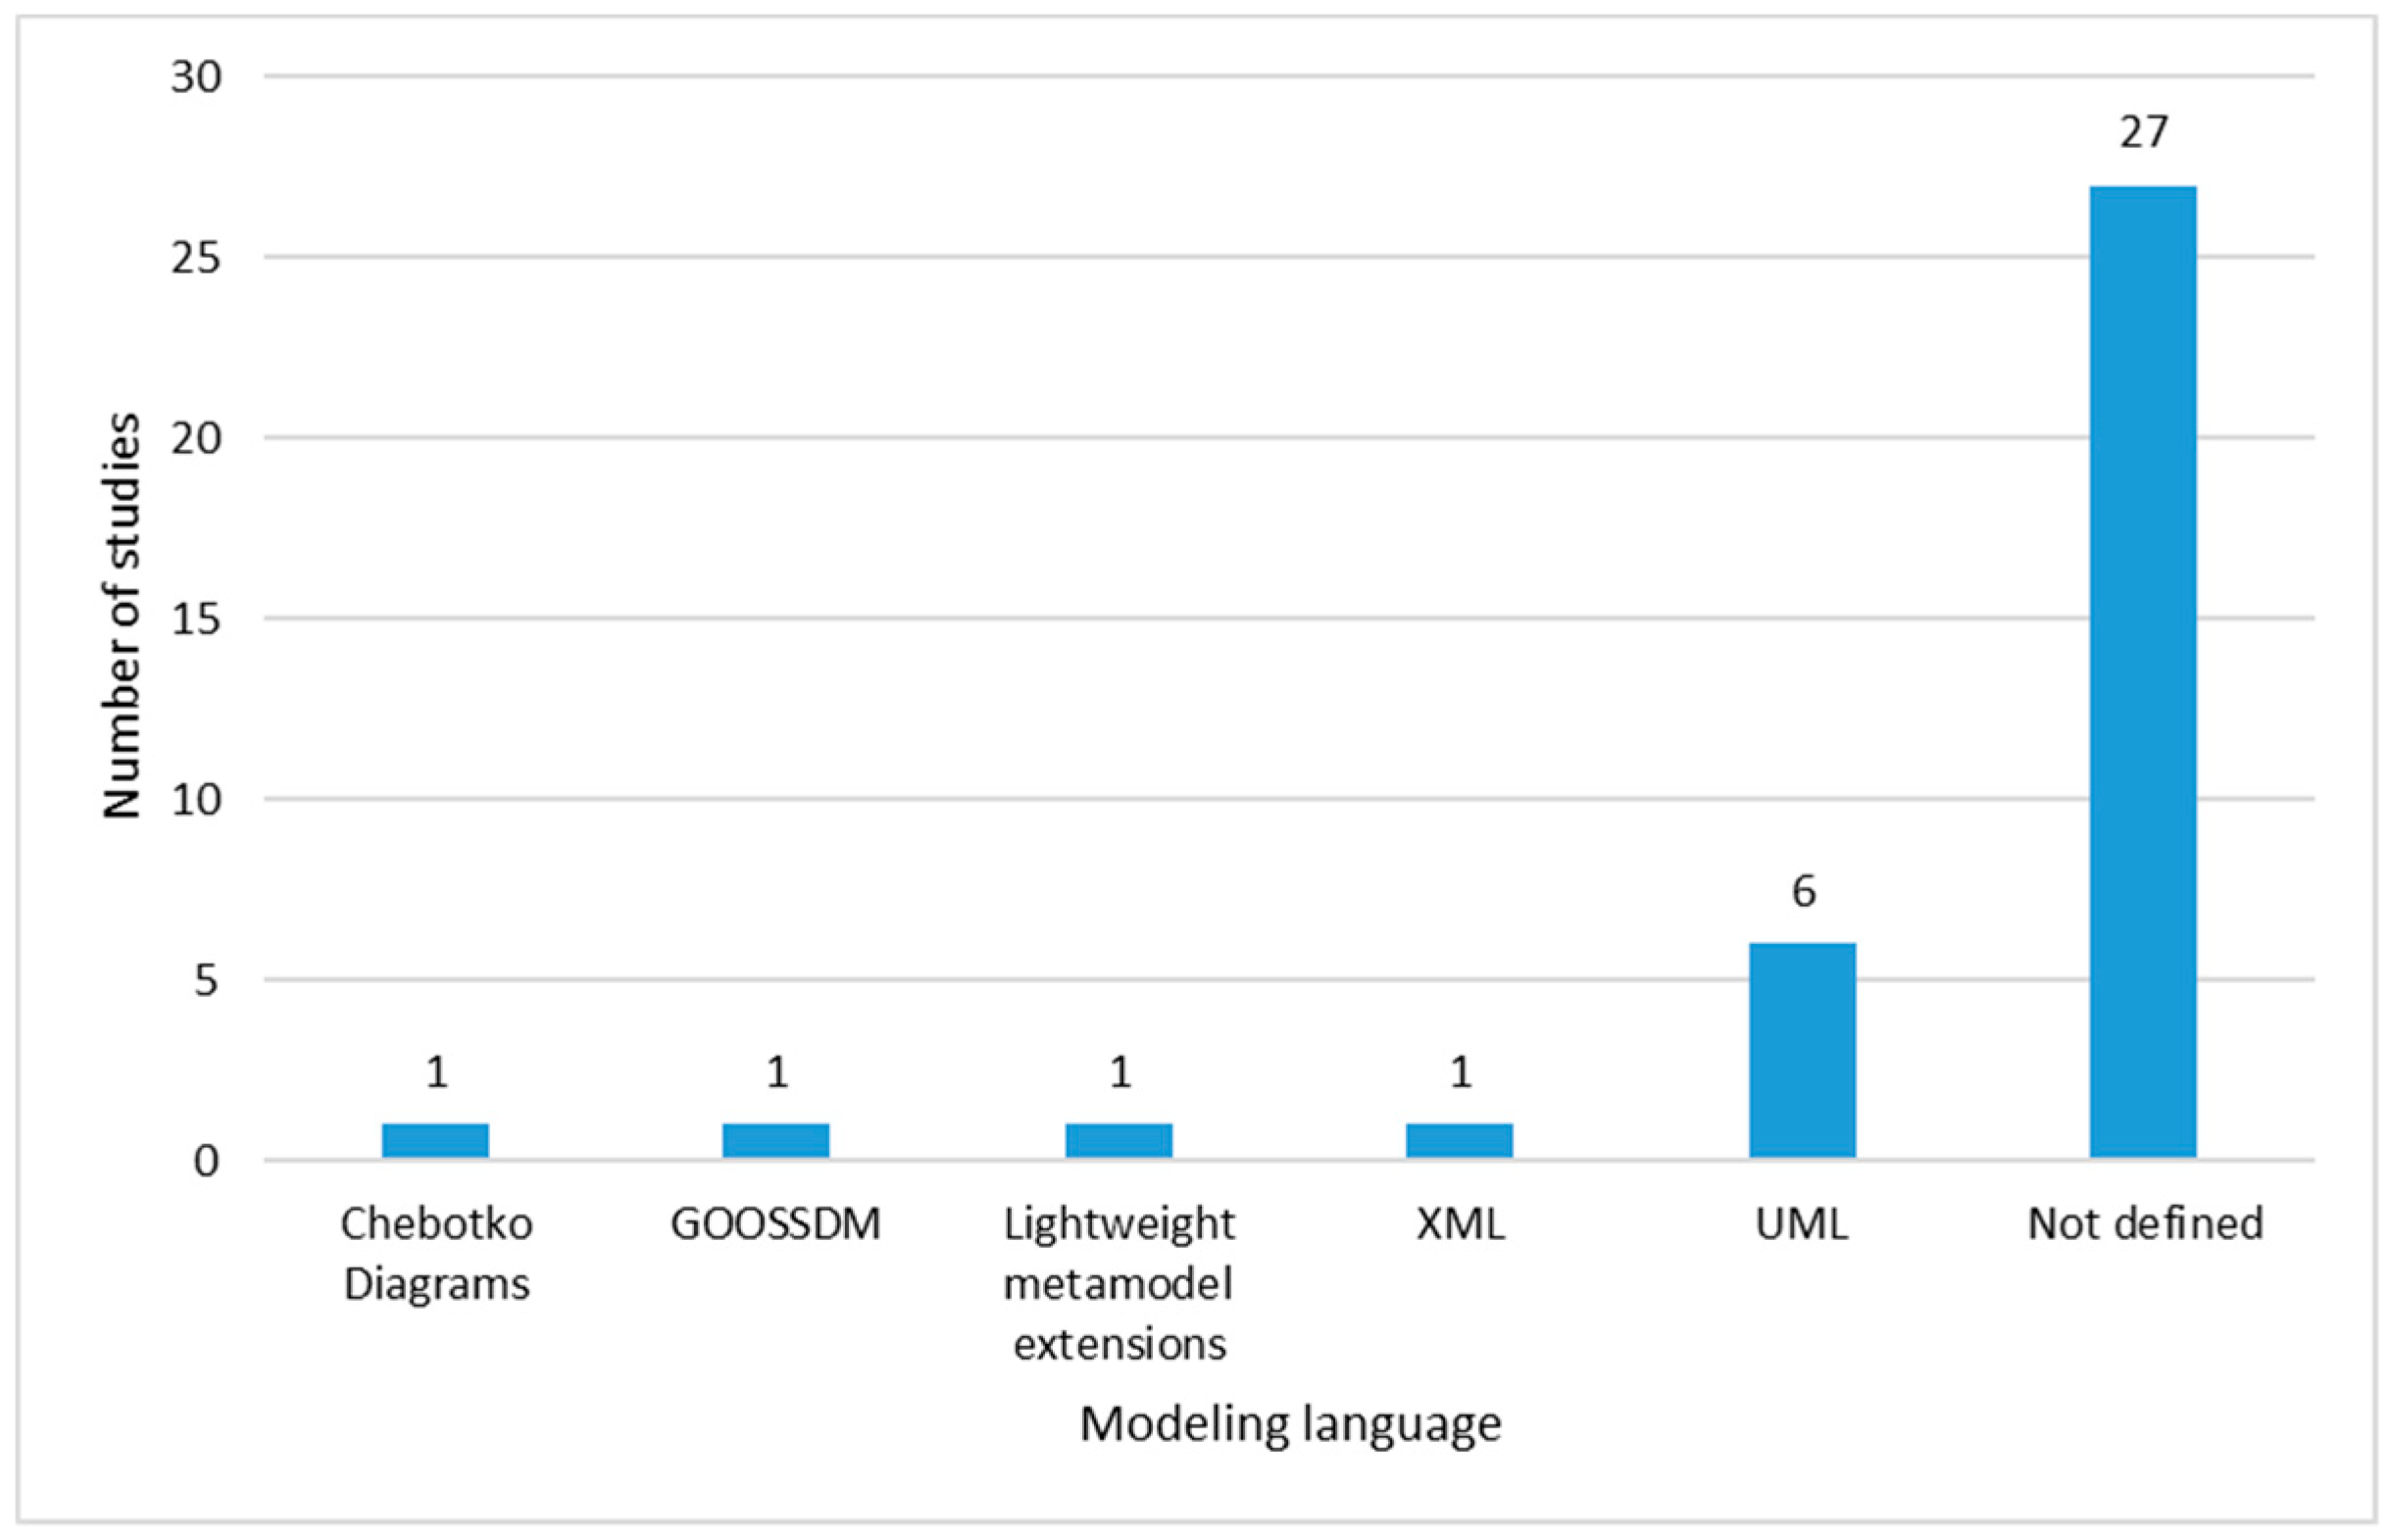
Figure 15. Data Modeling Language.
According to Figure 15, there is not a trend of data modeling language. There are 27 studies that do not define a standardized language used for the visualization of the models. Only six studies are adjusted to a standard such as the Unified
Modeling Language (UML) and the other four propose the use of their own modeling language, like Chebokto diagrams, Graph Object Oriented Semi-Structured Data Model (GOOSDM), lightweight metamodel extensions and XML. Of the six studies
that present their models with the use of the UML, two of them use it in the conceptual level model, one uses it in the conceptual and logical models and three use it in all conceptual, logical and physical levels.
According to several
authors and several implementation experiences, an important difference between relational databases and NoSQL databases is that the latter do not require normalization; that is, they support duplicated data. In this situation, data modeling
in NoSQL databases generally begins with the formulation of questions about how the database data are to be consulted. These questions will define the entities and the relationships between those entities. This new paradigm moves from
a data-driven modeling process to a query-driven modeling process. Thus, in the following concept, the methodologies for modeling data proposed in the final corpus of selected articles will be analyzed.
Modeling Methodology
As mentioned in the previous concept, this section aims to reveal the data modeling methodology proposed by the studies. According to the attained results, the trend of the proposals is to use the data-driven methodology presented in 33 studies.
Data-driven modeling is a technique that, based on how the data are organized within the dataset and how they are derived from external systems, generates all the components to represent a model. Only five studies propose query-driven
modeling; it should be mentioned that the studies that propose workload-driven modeling, that are also based on query-driven, have been considered within these five studies.
Modeling Tool
We consider it important to know whether the selected studies also propose a computer tool for aiding in the model elaboration from scratch, validating the elaborated models and assisting in the automatic transformation between abstraction levels. Of the results obtained in the concept matrix, as shown in Figure 16, 29 studies do not propose any tool. Only two studies propose the use of the Eclipse Modeling Framework (EMF). Similarly, there are five studies that propose separate tools such as Kashlev Data Modeler (KDM), scripts in Haskell, Mortadelo, Neoclipse, NoSQL Schema Evaluator (NoSE). It is worth mentioning that all these tools allow modeling at the three levels of data abstraction.
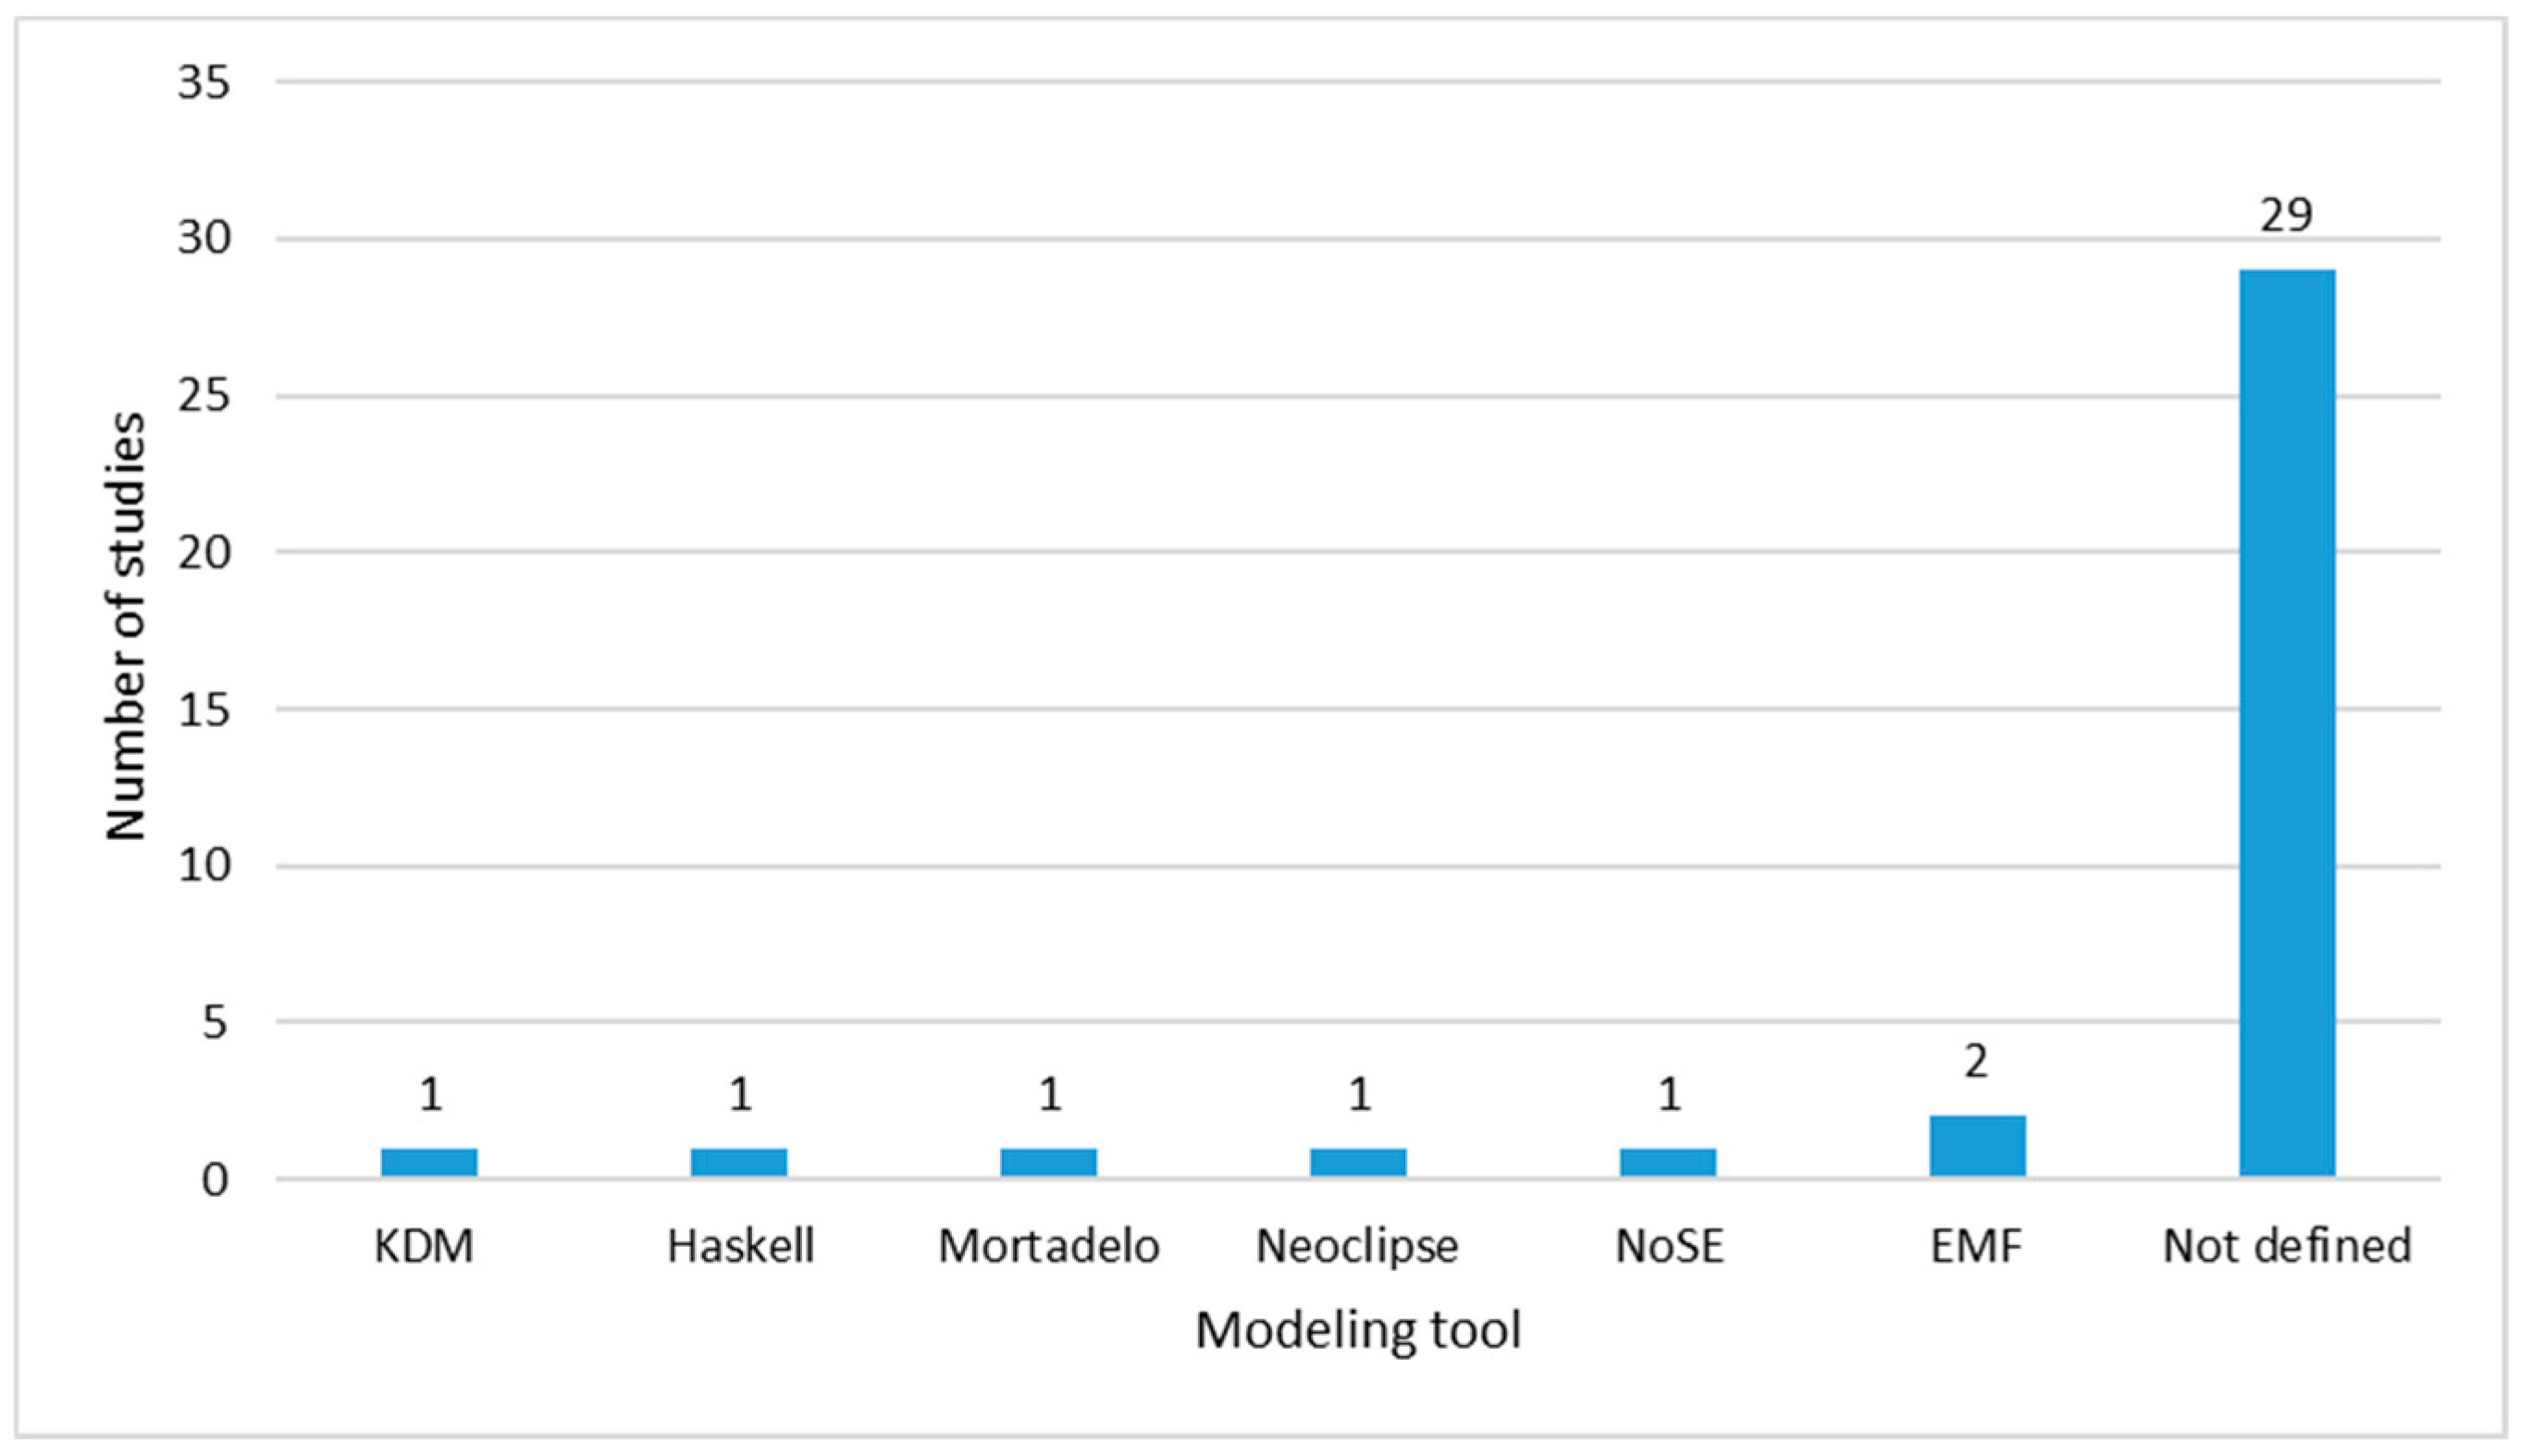
Figure 16. Data modeling tool (Eclipse Modeling Framework (EMF), Kashlev Data Modeler (KDM), NoSQL Schema Evaluator (NoSE)).
3.2.3. Database
In this section, we identified the proposed database types and the evaluation and performance comparisons carried out by the studies.
Database Type
At this aspect, we present the database types that the selected relevant studies proposed. They have been classified into two main groups, homogeneous and hybrids. By homogeneous, we mean those databases where the data are implemented in a single database. By hybrids, we mean systems where there are several databases implemented that can be relational and/or NoSQL. According to several studies, due to the variety characteristics of Big Data, the design and management of a database has become complex, so the systems are oriented towards a Polyglot Persistence System (PPS). This means that, when Big Data is stored, it is better to use different storage technologies, that are hybrid databases, so that applications can select the most appropriate one depending on the data they need. Polyglot Persistence is the term used when an application is able to query data from different NoSQL databases.
According to the results of our SLR, 20 studies propose homogeneous solutions - that is, they focus on a single type of database - and only eight propose hybrid solutions. It is worth mentioning that, of these eight studies, none presents
a solution that implements the following data models: E-R, document-oriented, column-oriented and graph. Likewise, eight studies do not define any type of physical implementation.
Among the studies that present solutions for at least three types of different DBMS are one that proposes implementations in SQLite, MongoDB, MySQL and Neo4j; another one that proposes implementations in MySQL, MongoDB and Cosmos; and another
one that proposes implementations in Cassandra, MongoDB and Neo4j.
Evaluation and Performance Comparison
In this concept, the studies that have made an evaluation and performance comparison of their data models are presented. We consider this topic important, due to the results obtained in the Transformation between Abstraction Levels subsection, where the results found that nine studies present individual proposals, 12 undefined and six with different techniques.
Similarly, in the Modeling subsection, 27 studies do not present a standard modeling and, according to the Modeling Tool subsection, 29 studies do not define an automatic modeling tool. Based only on this information, it is difficult to select any of the proposals. For this reason, some of the works have carried out an evaluation of their proposed approaches, based on the data load time and the query execution time. From the requested results in Appendix A, eight studies submitted an evaluation of their proposals regarding query execution times, one study evaluates model transformation times and another study compares data loading times. Finally, some articles have mentioned the usefulness of reverse engineering to verify the validity of a proposed model. Only one study is focused on this aspect but it does not test it.
According to the data of the key concepts analyzed previously, the trends and gaps found in our SLR study are presented in the discussion.
3.3. Discussion
In this section, we answer RQ3. Firstly, we refer to the relevant information attained from the bibliometric analysis. From this analysis, it is possible to verify the growth of this research topic. Since 2015, the number of studies has increased around 100 times and 2018 is the year with the most publications. Scopus is the source holding the highest number of relevant studies. The countries with the greatest contribution in the topic of Big Data modeling are the USA and China and more than 50% of the studies are funded.
Those data suggest existent interest in the topic in the research community. Although many researches refer to the Big Data analytics side, the engineering that takes care of the platforms, extraction techniques and loading and transforming data until reaching the required storage, is of no lesser importance, since these comprise the starting point required by analytics processes in order to produce value from the data.
Next, we will take the information attained from the SLR as a reference to discover the trends and gaps in the topic of interest.
3.3.1. Trends
To summarize the observed trends, Figure 17 helps as a reference to present the three main concepts that this analysis is focused on: source, modeling and database.
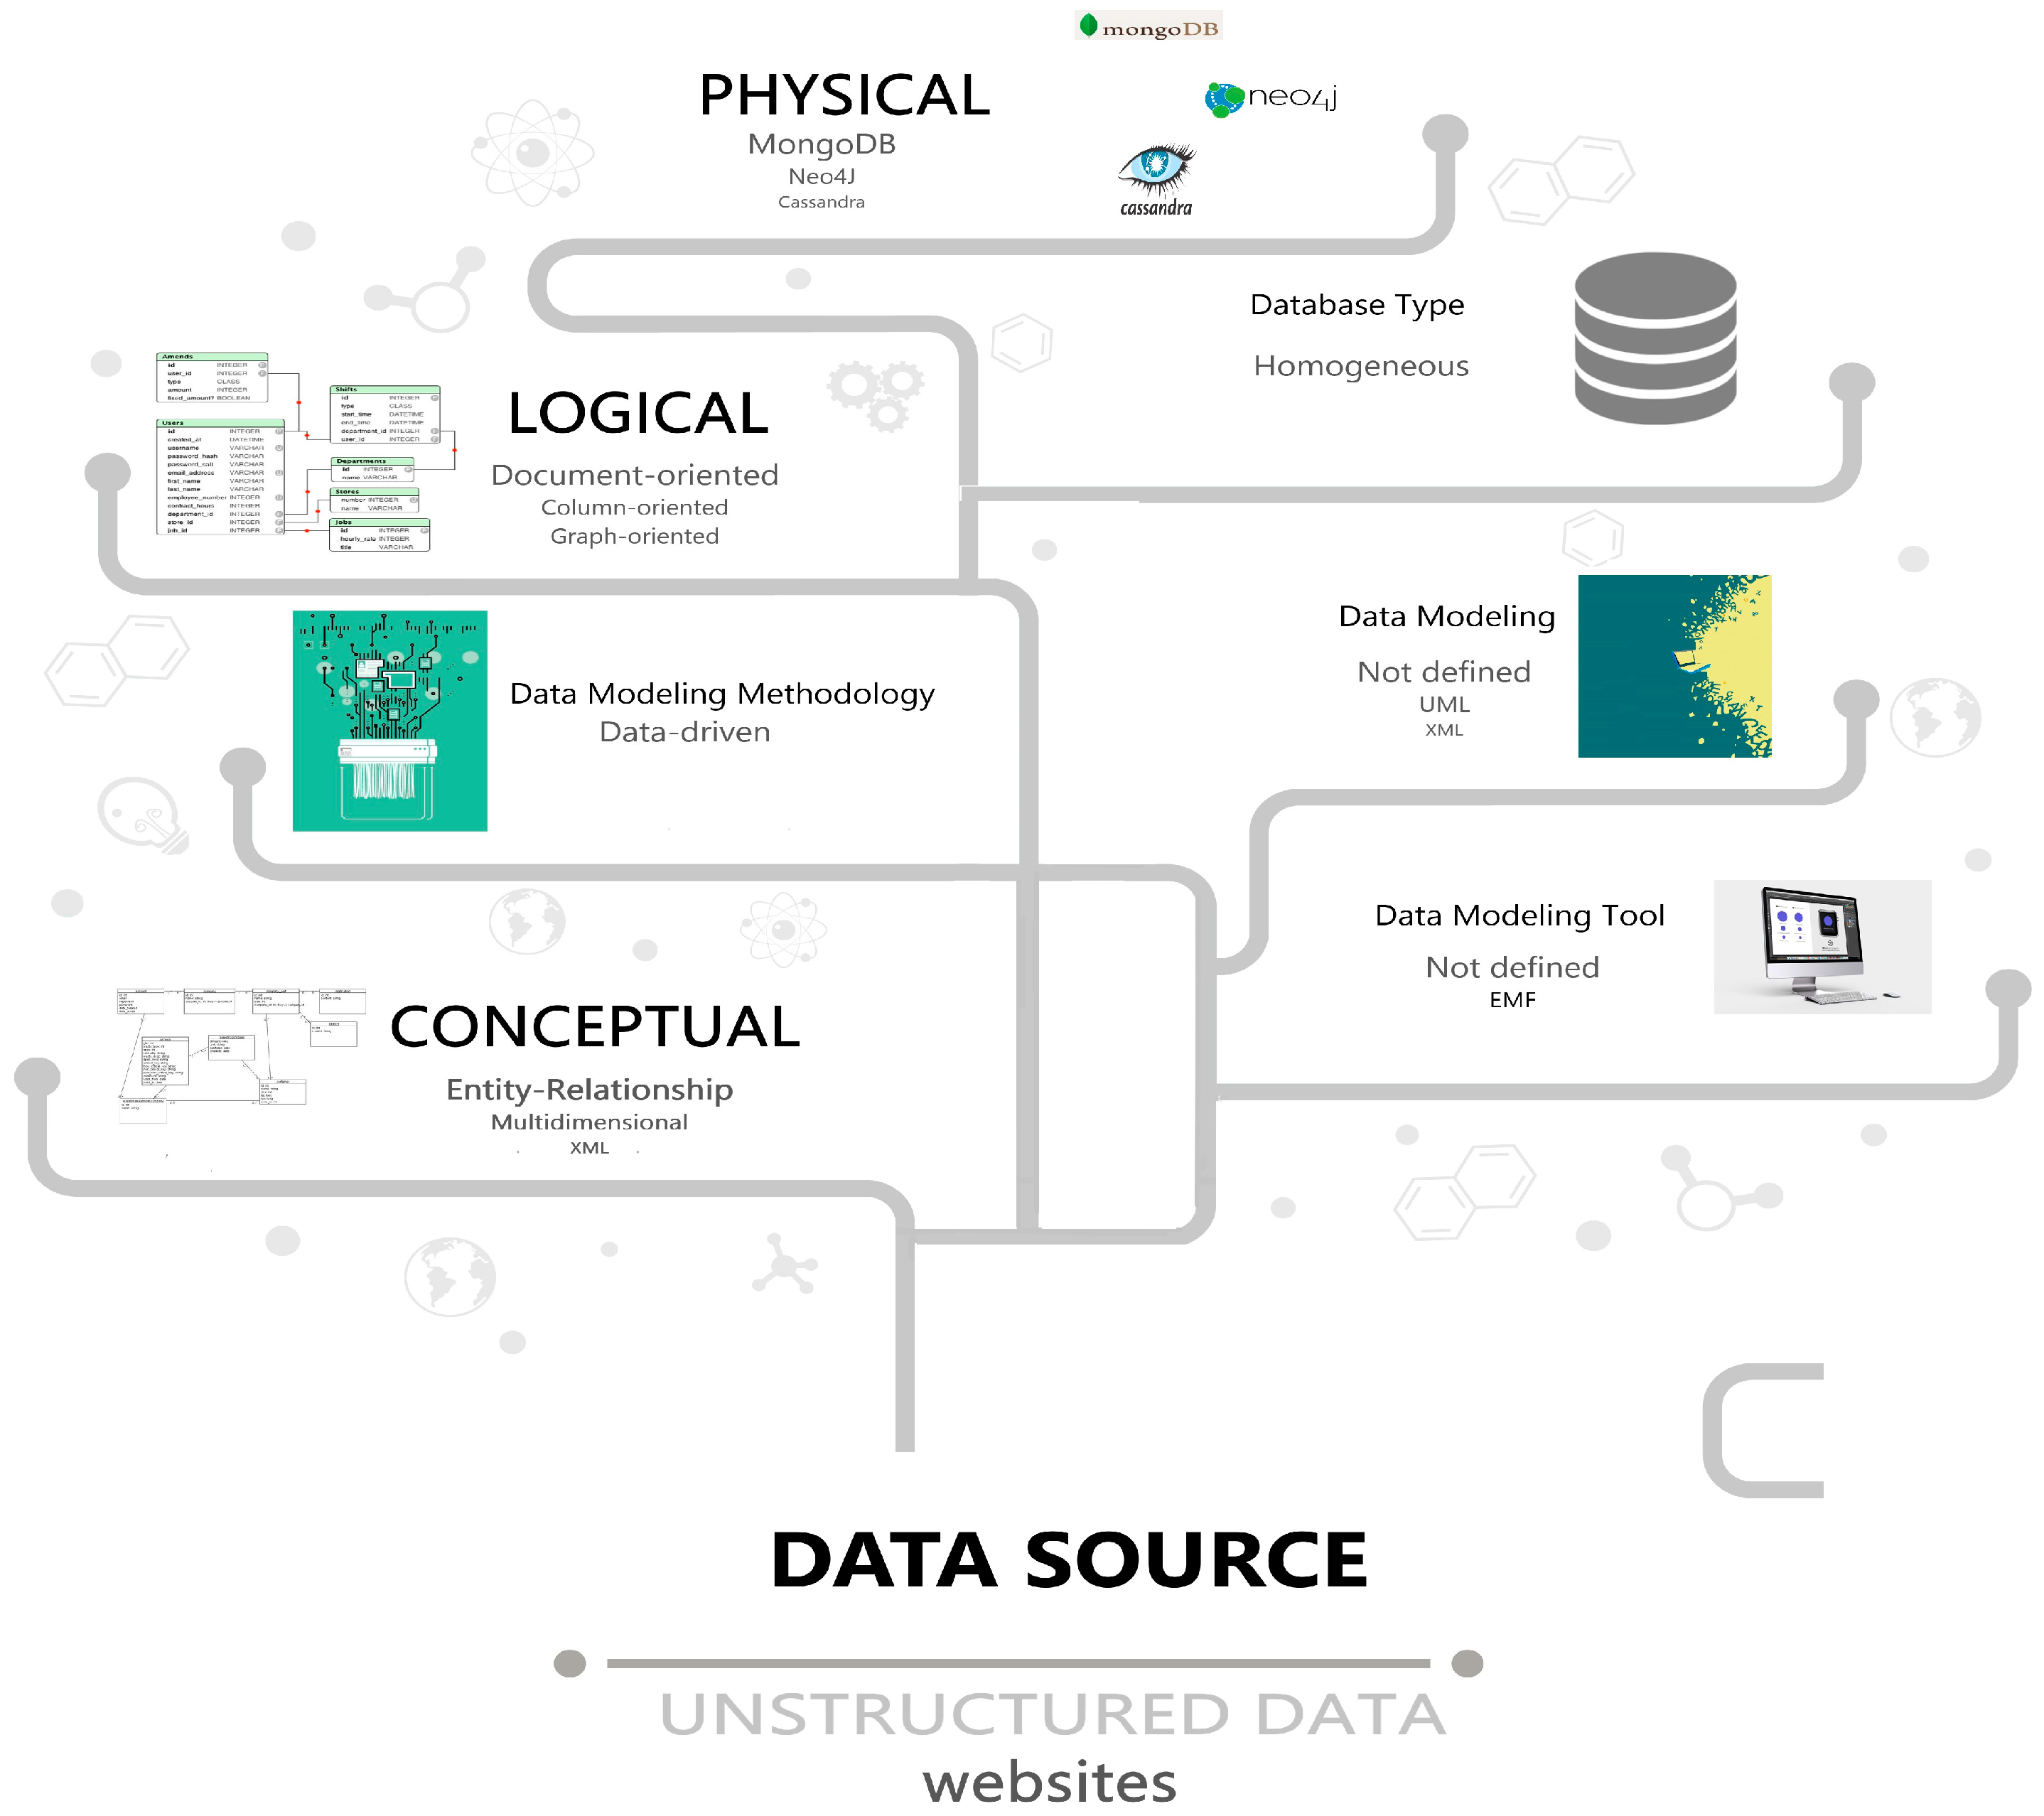
Figure 17. Trends for Big Data Modeling and Management.
Source
For the Source aspect, the most researched data sources are unstructured data, specifically website information.
Modeling
For the Modeling aspect, seven main trends were identified within the analyzed corpus:
- Most studies present their proposals at the conceptual, logical and physical abstraction levels;
- ER model is the most used in the approaches at the conceptual abstraction level, followed by the multidimensional model and, thirdly, XML;
- At the logical abstraction level, the most researched model is document-oriented, followed by column-oriented and graph-oriented;
- At the physical abstraction level, implementations focus more on the MongoDB DBMS, followed by Neo4j and Cassandra. Thus, the following de facto standards have emerged, MongoDB for the document-oriented data model, Cassandra for column-oriented and Neo4j for graph data model. These data are supported by statistical information from DB-Engines Ranking - Trend Popularity of the Solid IT company as of December 2019;
- The most proposed modeling methodology is data-driven;
- There is not a clear tendency towards a data modeling approach but there are proposals with UML and XML;
- No data modeling tool is defined as a trend but some studies used EMF;
- Regarding the different fields of application, ER is commonly used at the conceptual abstraction level in the different case studies. At the logical level, approaches for the migration from relational to document-oriented, graph and column-oriented models are proposed. Specifically, for spatio-temporal and transmission data, solutions for the graph model are proposed. And, for XML and JSON formats from web servers, solutions for all NoSQL data models are suggested.
Database
For the Database aspect, 55.55% of the studies focus on homogeneous database types, so the trend towards a persistent polyglot system is not observed.
3.3.2. Gaps
Figure 18 allowed us to identify also three main concepts for analyzing the gaps: source, modeling and database.
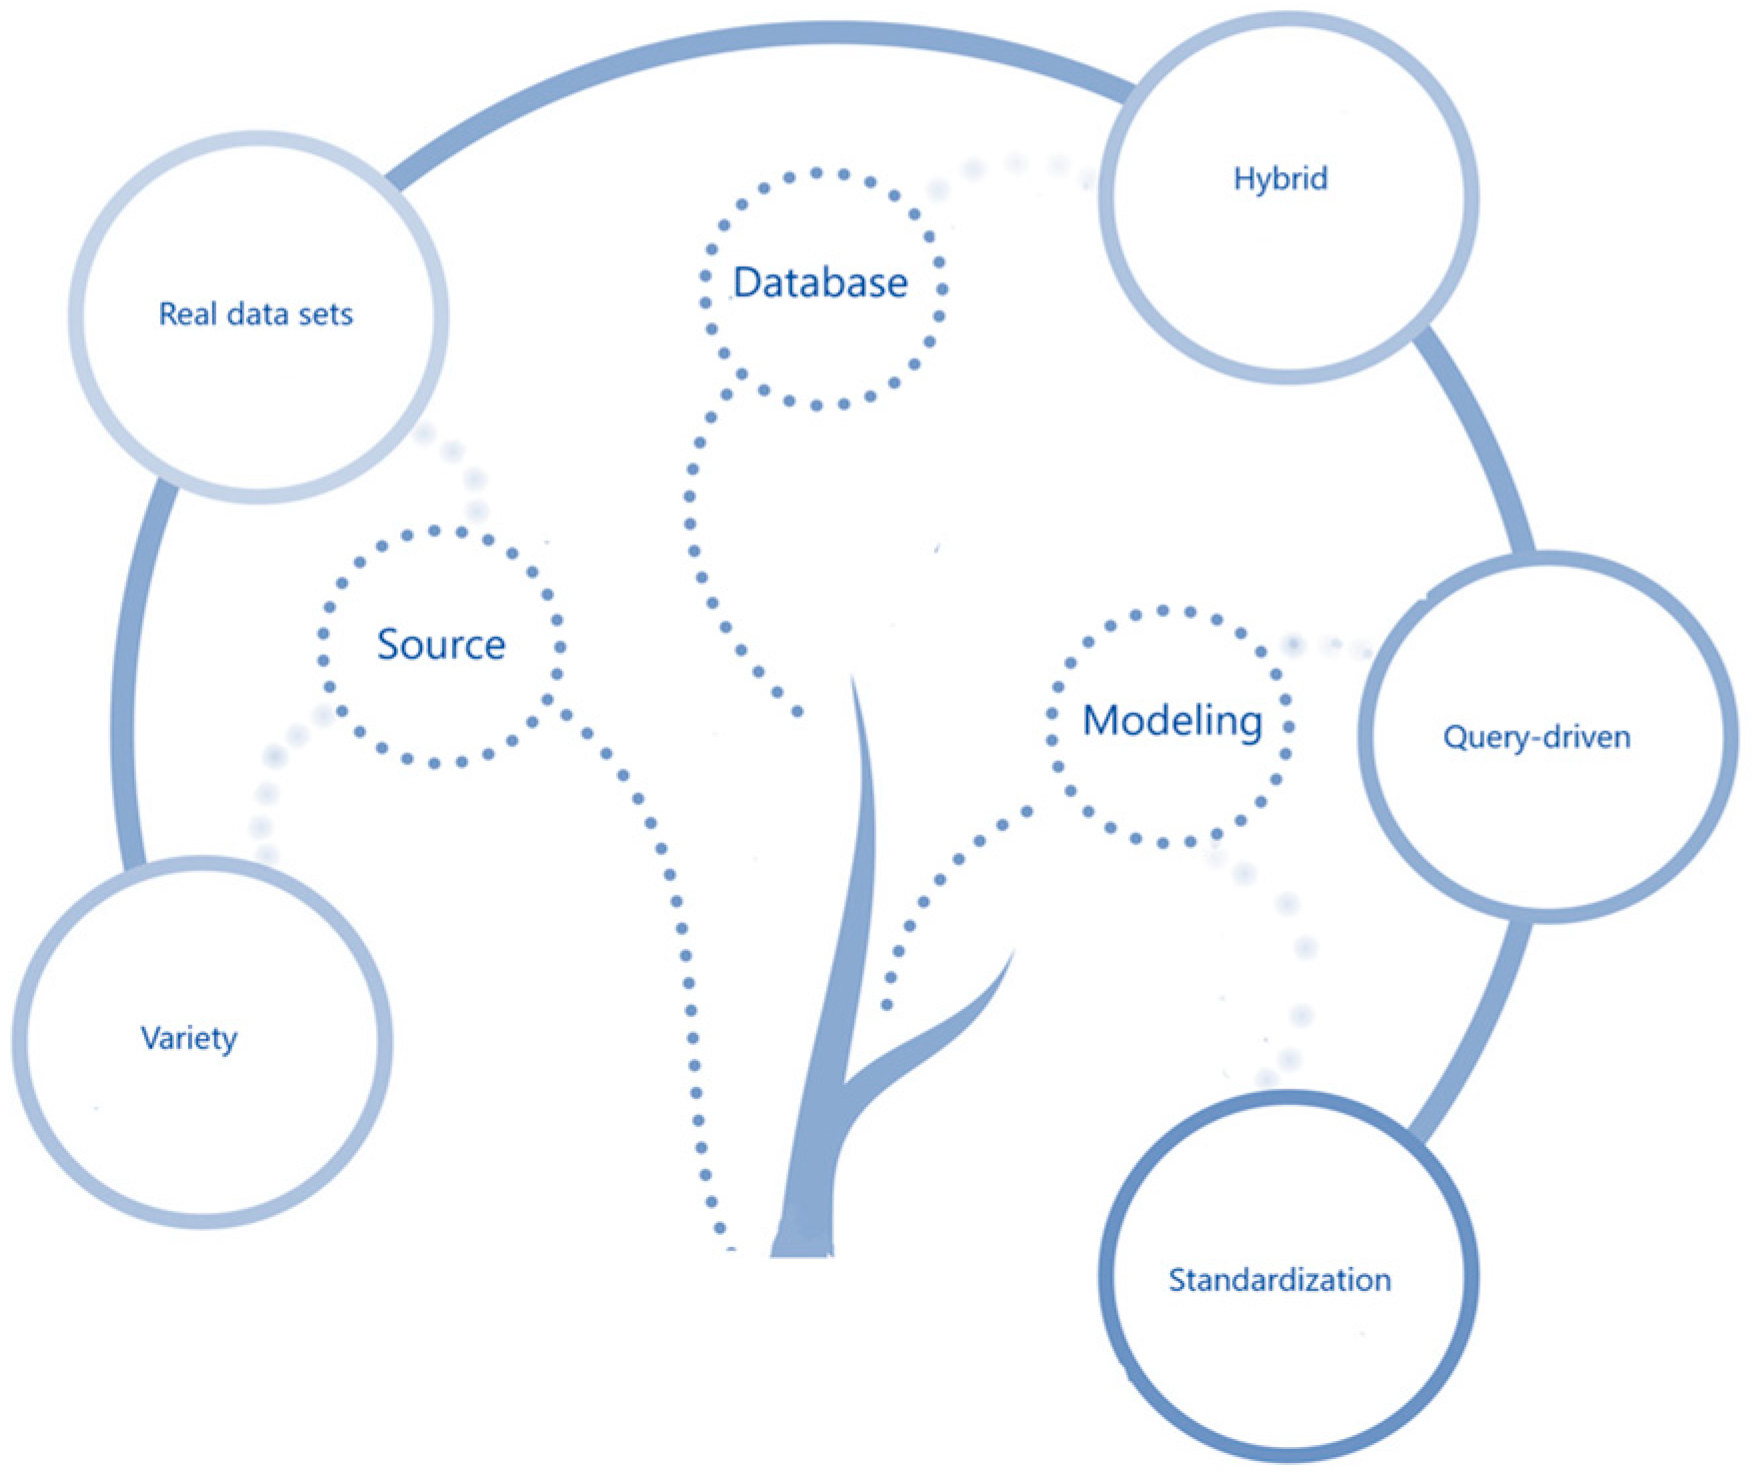
Figure 18. Gaps for Big Data Modeling and Management.
Source
For the Source aspect, two main gaps were identified within the analyzed corpus:
- One of the main objectives of Big Data is to use the data to generate value; this value will depend on the needs of the business. For this reason, it is considered very important that studies are validated with real use cases, since only with the use of real datasets can whether value is being generated be verified. As result of our SLR, only ten studies, corresponding to 27.78%, use real datasets; 16.67% of these works present their case studies with data from websites, 5.56% use data from sensors and 2.78% involve electronic documents' data and images' metadata;
- Additionally, other Big Data main features must be guaranteed, such as volume, velocity and veracity. According to the results of Table 6, not all of these features are justified in the approaches;
- To comply with the variety, studies should consider that data can come in any format: structured, semi-structured or unstructured. Therefore, the proposed approaches should address any of these types. Only 2.78% have proposed a solution for all three types of data. The remaining 47.22% of the studies only present approaches for unstructured data, 30.56% only for structured data, 13.89% for semi-structured data, 2.78% combine structured and semi-structured data and 2.78% do not specify any type.
Modeling
For the Modeling aspect, the five main gaps found in our study correspond to standardization and data modeling methodology. Standards are considered important, since they guarantee a universal, uniform interpretation, readability of the data model, portability between database engines, platforms and applications, among other facilities for project managers, analysts, designers, developers and end-users of the databases. In summary, the results are as follows:
- There is no standardization regarding the definition of mapping rules for the transformation between models at the conceptual, logical and physical data abstraction levels. Thus, the 36 studies propose different approaches for the transformation, making it difficult for users to choose the most appropriate one;
- No NoSQL system has emerged as a standard or as a de facto standard yet;
- There is no clearly defined use of some standardized language or method for modeling data at the logical and physical levels. According to the results of our SLR, only at the conceptual level can ER be considered as a trend, maybe because the conceptual level is technologic-agnostic;
- As mentioned in the Modeling Language subsection, for NoSQL databases the new paradigm for the modeling process is query-driven. However, only five studies are focused on this methodology.
- For Big Data analysis, the implementation of efficient systems is required. In the data-driven methodology, the models are designed before assessing what queries will be performed. The limitation of this solution is that all data will be stored, when only a limited fraction are needed to answer the required queries. On the contrary, in query-driven methodologies, a set of queries must be expressed, evaluated and integrated before modeling, so that planning can focus on the answers to the necessary queries. For solutions where real-time data are used, data-driven models have the risk of being impractical because of the diverse nature of data streams.
- A research demonstrates that the treatment of data, in terms of time–cost, with the use of query-driven requires less processing time than data-driven. This, in turn, leads to smaller amounts of consumed energy and, therefore, longer life of equipment.
- According to another study, the use of a query-driven methodology allowed users to make queries in a natural user language that focuses on relevant regions of interest;
Techniques such as reverse engineering are not taken into account; thus, this detail could complement the studies. This method is widely used in relational databases on projects that work with existent databases and when no documented models exist (or there is a risk of these models being outdated).
Database
For the Database aspect, the main gap found is related to the variety characteristics of Big Data. To manage this feature correctly, NoSQL databases must be targeted to PPS. A PPS can be obtained through storage in hybrid databases; that is, it supports different storage technologies. Only eight studies have proposed solutions oriented to hybrid databases and, out of these, only one study demonstrated this with a real case that models and manages both structured, semi-structured and unstructured data and stores them in different databases.
4. Conclusions
As a limitation, we know that we were not able to collect all the existent research about the topic, due to the vast number of synonyms and constraints in the major search terms. However, the high quantity of primary studies - a set of 1376 papers was obtained - provides a trustworthy and complete data set.
The SLR study on Big Data modeling and management conducted in this paper has identified 36 relevant studies. These works have been selected based on the inclusion and selection process of research papers from digital scientific libraries until August 2019; there are no published papers prior to 2010.
We have raised three research questions that were answered through bibliometric analysis, an SLR and a discussion. The results of the bibliometric study provide a lot of relevant information. For instance, from 2015 onwards, the number of studies has increased significantly as this was the year when many countries started to contribute to the topic of interest. The leading countries in this topic are the USA and China. The USA have one of the most impactful studies.
The results from the SLR and from the Discussion also reveal some very interesting facts. For instance, more than 50% of the studies do not verify their proposals with real-world datasets. Big Data's velocity characteristic is not justified by 90% of the studies. ER is the most used model at the conceptual abstraction level, document-oriented is the most researched model at the logical abstraction level and MongoDB DBMS is the most frequent implementation at the physical level. Moreover, as the main gaps, we identified the lack of proposal evaluations and a few studies focused on query-driven methodology and hybrid database solutions.
The contribution of this SLR study, by clarifying the knowledge on the specific topic of Big Data modeling, can support researchers and practitioners in improving their Big Data projects. The relevant works collected can be a useful starting point to new studies into Big Data modeling.
Finally, we know that, due to the need to analyze large volumes of data with a variety of structures, which arrive in high frequency, database research became more focused towards NoSQL. However, NoSQL DBMSs have not been able to acquire some strengths that are already present in relational databases, such as the ability to support Consistency and Availability at the same time; for this reason, NewSQL has emerged and may pose a solution to the problems faced by both DBMSs. As a future work, we also expect to study this new database system.
We hope to keep the SLR up to date and present results for other concepts. Moreover, based on the gaps, we will drive our research in these aspects.