Bank Regulatory Capital Requirements
| Site: | Saylor Academy |
| Course: | BUS614: International Finance |
| Book: | Bank Regulatory Capital Requirements |
| Printed by: | Guest user |
| Date: | Saturday, October 12, 2024, 12:32 AM |
Description
Basel recommendations were enacted to help evade any financial malpractice that could negatively affect the national and international economy. It is important to keep up to date with the latest recommendations. This reference will elaborate on capital adequacy and the capital requirements in the US. What banks in the US are subject to comprehensive capital analyses and supervisory stress?
Abstract
After the Latin American Debt Crisis of 1982, the official response worldwide turned to minimum capital standards to promote stable banking systems. Despite their existence, however, such standards have still not prevented periodic disruptions in the banking sectors of various countries. After the 2007–2009 crisis, bank capital requirements have, in some cases, increased and overall have become even more complex. This paper reviews (1) how Basel-style capital adequacy guidelines have evolved, becoming higher in some cases and overall more complex, (2) how the United States (US) implementation of these guidelines has contributed to regulatory complexity, even when omitting other bank capital regulations that are specific to the US, and (3) how the US regulatory measures still do not provide equally valuable information about whether a bank is adequately capitalized.
Keywords: bank regulation; capital adequacy standards; regulatory complexity; US banking crises
Source: James R. Barth and Stephen Matteo Miller, https://www.mdpi.com/1911-8074/11/4/77/htm#
 This work is licensed under a Creative Commons Attribution 4.0 License.
Introduction
Banks are vital in facilitating the exchange of goods and services by providing a payment system and channeling savings to productive investment projects that foster economic activity. However, banking crises have historically contributed to declines in overall economic activity. Furthermore, the ensuing policy response to crises often calls for implementing a variety of banking reforms that may be ineffective or even undermine existing policies.
Capital requirements can be an important tool that bank regulators use to promote a well-functioning banking system, presuming that sufficient levels of owner-contributed equity capital improve a bank's ability to withstand large shocks to asset values. These requirements have grown increasingly complexity in recent decades. Fully understanding their nuances presents a challenge, even for those who have spent substantial time studying them. Further adding to the challenge is the existence of multiple capital requirements that are satisfied by different items.
This review of bank capital regulation discusses the growing complexity of Basel capital adequacy guidelines, which, when implemented by a country's regulators, pose a challenge for bank regulatory compliance, oversight, and academic and policy analysis. As evidence of that growing complexity we show that regulatory capital requirements can generate up to 25 percent of all regulatory restrictions and on average thousands of additional words embodied in the parts of the United States (US) Code of Federal Regulations (CFR) that concern banks.
We also show that despite the increased complexity of the regulatory capital ratios, they do not provide equally valuable information about whether a bank is adequately capitalized. The data presented clearly indicate that whether banks have too little capital or excess capital depends on the specific capital ratio on which one focuses and whether the capital ratio is based on the riskiness of a bank's business model. Some ratios may indicate that a bank has sufficient capital while other ratios indicate the opposite. A higher regulatory capital ratio that is imposed on banks may or may not affect bank behavior. The specific ratio that regulators choose to increase is crucial. In the aggregate, the market knows that not all ratios are equally revealing about a bank's actual capital adequacy, and thus some ratios receive more attention than others. Given this situation, emphasis could be placed on a straightforward and easily understood capital ratio that market participants have always paid attention to when they assess whether a bank is adequately capitalized. Indeed, some recent studies show that the benefits outweigh the costs.
The remainder of the paper proceeds, as follows. The next section summarizes the Basel Capital Accords and their US implementation. Section 3 discusses additional regulatory measures that US regulators apply, including Prompt and Corrective Action (PCA), comprehensive capital analyses, and supervisory stress testing to which regulators now subject the larger banks. PCA describes the actions that banking regulators are legally required to take as a bank's capital declines below specified minimum levels. This is important because, based on publicly available information, researchers are able to determine whether the regulatory authorities actually take the actions that are required when banks encounter financial difficulties. Section 4 explains that the new capital requirements have generated considerable controversy because they require banks to hire more employees with quantitative skills, which results in an increase in costs without a corresponding increase in revenues. It is not clear, moreover, whether the more extensive analyses and testing contribute to a safer and sounder banking system. Section 5 concludes with a suggestion for greater emphasis on a minimum required capital ratio that eliminates most of the confusion over determining whether a bank is adequately capitalized – one that market participants themselves relied on during the most recent banking crisis of 2007–2009.
Capital Adequacy Standards: Basel Guidelines and Their US Implementation
Basel Capital Adequacy Guidelines
The central bank governors of the G10 countries established a Committee on Banking Regulations and Supervisory Practices at the end of 1974 following disruptions in the international financial markets after the breakdown of the Bretton Woods system of managed exchange rates. The committee was later renamed the Basel Committee on Banking Supervision (BCBS). The aim of that committee was and is to promote financial stability by improving banking supervision worldwide. The BCBS seeks to accomplish its aims by establishing minimum standard guidelines for the regulation and supervision of large, internationally active banks. Since its first meeting in February 1975, the BCBS has been meeting regularly three or four times a year. Membership was expanded beyond the G10 in 2009 and again in 2014, so that 28 jurisdictions – 27 countries and the European Union – are now included in the BCBS. BCBS decisions are recommendations, and are thus not legally binding on the member jurisdictions, but the BCBS "expects full implementation of its standards by its member jurisdictions and their internationally active banks".
The Latin American debt crisis of the early 1980s generated concerns about the adequacy of the capital of the large international banks. In response, Congress passed the International Lending Supervision Act of 1983, in part to get US regulators to find a way to raise capital requirements in a multilateral way since differences existed in national capital requirements and concerns existed that these differences would adversely affect banks in the US . Through the BCBS, these efforts culminated in the first Basel Capital Accord (Basel I) in July 1988. Basel I called for a minimum capital ratio, which was based on capital relative to risk-weighted assets (RWAs).
Table 1 offers a summary of the various capital requirements across Basel regimes, which under Basel I, included two tiers of capital, Tier 1 and Tier 2, which combined to form total capital, and these capital measures based on accounting or book values. We list the composition of the different capital concepts are listed in Table 2. Tier 1 capital was initially set at 3.625 percent of RWAs and then increased to 4 percent by the end of 1992, while total capital was increased from 7.25 percent to 8 percent of RWAs over the same period. The BCBS did not recommend a leverage ratio, or non-risk-based capital ratio, at the time.
Table 1. A Timeline of Basel Capital Accords.
| Regulatory Capital Standards | Basel I a(%) | Basel II b(%) | Basel II.5 c(%) | Basel III d (%) | ||||||
|---|---|---|---|---|---|---|---|---|---|---|
| 1993–2010 | 2011 | 2012 | 2013 | 2014 | 2015 | 2016 | 2017 | 2018 | as of 1 January 2019 | |
| Minimum Tier 1 capital (CET1 plus additional Tier 1) | 4.0 | 4.0 | 4.0 | 4.5 | 5.5 | 6.0 | 6.0 | 6.0 | 6.0 | 6.0 |
| Minimum total capital (Tier 1 plus Tier 2 capital) | 8.0 | 8.0 | 8.0 | 8.0 | 8.0 | 8.0 | 8.0 | 8.0 | 8.0 | 8.0 |
| Common equity leverage ratio e (viewed as a backstop to risk-based ratios) | n/a | supervisory monitoring | test period and disclosure starts 1 January 2015 | 3.0 | 3.0 | |||||
| Minimum CET1 capital ratio | n/a | 2.0 | 2.0 | 3.5 | 4.0 | 4.5 | 4.5 | 4.5 | 4.5 | 4.5 |
| Phase-in of deductions from CET1 (including amounts exceeding the limit for deferred tax assets, mortgage servicing rights, and financials) | n/a | n/a | n/a | n/a | 20 | 40 | 60 | 80 | 100 | 100 |
| Capital conservation buffer | n/a | n/a | n/a | n/a | n/a | n/a | 0.625 | 1.25 | 1.875 | 2.50 |
| Countercyclical capital buffer (discretionary, 0.0% to 2.5%), to be filled with Tier 1 capital | n/a | n/a | n/a | n/a | n/a | n/a | 0.625 | 1.25 | 1.875 | 2.50 |
| Capital surcharge for global systemically important banks | n/a | n/a | n/a | n/a | n/a | n/a | 0.25 to 3.5 | 0.5 to 3.5 | 0.75 to 3.5 | 1 to 3.5 |
| Capital instruments that no longer qualify as noncommon equity Tier 1 capital or Tier 2 capital | n/a | n/a | n/a | 10% per year phase out over 10-year horizon beginning 1 January 2013 f | ||||||
Note: CET1 = common equity Tier 1, n/a = not applicable. a Basel I was finalized in July 1988 and implemented over the period 1988–1992. The figures in the column for Basel I show the final capital standards after implementation. bBasel
II was finalized in June 2004 and implemented over the period 2007–2010. The figures in the column for Basel II show the final capital standards after implementation. c Basel II.5 was finalized in July 2009 and meant to be implemented no later
than 31 December 2011. Basel II.5 enhanced the measurements of risks related to securitization and trading book exposures. d Basel III was finalized in December 2010 and meant to be implemented over the period 2013–2018. eThe leverage
ratio is calculated as the ratio of Tier 1 capital to balance-sheet exposures plus certain off-balance-sheet exposures. f The phasing works by capping the amount that can be included in capital from 90 percent on 1 January 2013, and reducing
this cap by 10 percent in each subsequent year.
Table 2. Components of Total Capital.
| Tier 1 capital | At least 50 percent of a bank's capital base to consist of a core element comprised of equity capital and published reserves from post-tax retained earnings minus goodwill |
| Tier 2 capital | Undisclosed reserves, asset revaluation reserves, general provisions/general loan-loss reserves, hybrid (debt/equity) capital instruments and subordinated debt, and limited to a maximum of 100 percent of the total of Tier 1 elements |
Note: Tier 1 capital did not include goodwill, which is the present value of conjectural future profits arising from an acquisition when the amount paid is in excess of the target firm's value, because its ability to absorb losses is unclear. Goodwill shows up on the balance sheet, but is recognized as not being easily converted into cash.
However, the BCBS intended these capital ratios to evolve over time as events unfolded and new information became available. In January 1996, for example, the BCBS issued guidelines within Basel I to incorporate market risks in capital requirements, since initially only credit risks were addressed. This new capital requirement took into account the risk of losses in on-balance-sheet and off-balance-sheet positions arising from movements in market prices. At the same time, a third kind of regulatory capital, Tier 3, became part of total capital . These changes were to take effect at the end of 1997 and allowed banks, for the first time, to use internal models (value-at-risk models) as a basis for calculating their market-risk capital requirements.
In June 2004, the BCBS replaced the Basel Capital Accord (Basel I) with the Revised Capital Framework (Basel II). Basel II was made up of three pillars: Pillar I, which was designed to develop and expand the minimum capital requirements in Basel I; Pillar II, which provided for supervisory review of a bank's capital adequacy and internal assessment process; and, Pillar III, which called for the effective use of disclosure as a lever to strengthen market discipline and encourage sound banking practices. The minimum required risk-based capital ratios for Tier 1 and total capital were left unchanged at 4 percent and 8 percent, respectively, as shown in Table 1. The BCBS member countries and several non-member countries agreed to adopt the new guidelines, but on varying national timescales.
The BCBS agreed to Basel II.5 in July 2009 as a revision of Basel II, which BCBS members believed had failed to properly address market risk that banks took on their trading books. Basel II.5 introduced an incremental risk charge (IRC) to estimate and capture default and credit migration risk (i.e., the risk when customers move their loans from one bank to another bank). Basel II.5 also introduced an additional charge to compensate for an increase in one risk that leads to an increase in another risk (i.e., correlated risk). In addition, BCBS introduced stressed value-at-risk to require banks to calculate capital requirements under stress conditions. Lastly, standardized charges were introduced for securitization and re-securitization positions.
The BCBS issued Basel III in December 2010 and revised it in June 2011, after the global banking crisis. BCBS made the revisions to enhance the Basel framework and strengthen the three pillars that were established by Basel II. The new framework (Basel III) also introduced several regulatory capital innovations. Basel III established new minimum common equity and Tier 1 requirements and added an additional layer of common equity (the capital conservation buffer), a countercyclical buffer, a leverage ratio (based on both a bank's on-balance-sheet assets and off-balance-sheet exposures regardless of risk weighting), and supplementary capital requirements for systemically important banks. Also introduced were a liquidity coverage ratio (intended to provide enough cash to cover funding needs over a 30-day period of stress) to be phased in from 1 January 2015, to 1 January 2019, and a longer-term net stable funding ratio (intended to address maturity mismatches over the entire balance sheet) to take effect as a minimum standard by 1 January 2018.
The final capital standards introduced by Basel III were to be phased in over time, as shown in Table 1. The recommended leverage standard will be 3 percent in 2019. The recommended Tier 1 risk-based capital standard will be 6 percent and the total risk-based capital standard will be 8 percent. If one adds the capital conservation and countercyclical capital buffers to the total capital standard, the capital ratio can be as high as 13 percent for some banks, and even as high as 16.5 percent if one adds a capital surcharge of 3.5 percent for global systemically important banks (GSIBs).
The Financial Stability Board (FSB), which makes policy recommendations to G20 members, has proposed further increasing requirements on GSIBs through a total loss-absorbing capacity (TLAC) requirement. On top of the required minimum common equity Tier 1 (CET1) ratio of 4.5 percent, GSIBs would have to fund with an additional 11.5 percent of "loss absorbency" in the form of Tier 1 and Tier 2 capital relative to risk-weighted assets. This requirement would rise to 13.5 percent by 2022. The FSB expects GSIBs to meet this requirement in part through long-term, unsecured debt, which can be converted into equity when a bank fails. The emphasis on convertible debt is meant to put an end to "too big to fail" by forcing bondholders rather than taxpayers to inject capital into a large bank that fails.
US Bank Capital Requirements
While the US has for the most part adopted Basel guidelines, important differences exist, and Table 3 shows how the US implementation has varied according to Basel I, Basel II, Basel II.5, and Basel III. One important difference between the Basel guidelines and the US implementation has been that, unlike the former, the latter has included a leverage capital requirement in addition to the risk-based capital requirements. In addition, the US implementation applies to every bank, although some differences exist based on the bank's asset size. The risk-based capital requirements provide an incentive for banks to focus more on assets with lower risk weights, which can lead banks to change their business models.
Table 3. A Timeline of United States (US) Capital Requirements.
| Regulatory Capital Requirements | US minimum Capital Standards Based on Basel I a (%) | Basel II b (%) | Basel II.5 c (%) | Basel III d (%) | |||||||
|---|---|---|---|---|---|---|---|---|---|---|---|
| 1991–1992 | 1993–2010 | 2011 | 2012 | 2013 | 2014 | 2015 | 2016 | 2017 | 2018 | as of 1 January 2019 | |
| Minimum Tier 1 capital (CET1 + additional Tier 1) | 3.625 | 4.0 | 4.0 | 4.0 | 4.5 | 5.5 | 6.0 | 6.0 | 6.0 | 6.0 | 6.0 |
| Minimum total capital (Tier 1 + Tier 2 capital) | 7.25 | 8.0 | 8.0 | 8.0 | 8.0 | 8.0 | 8.0 | 8.0 | 8.0 | 8.0 | 8.0 |
| Tier 1 leverage ratio and supplementary leverage ratio e (viewed as a complement to risk-based ratios) f | 4 (3 for banks that are CAMELS 1-rated) | 4 | 4 | 4 | 3 (AA) | 3 (AA) | |||||
| 5 (GSIBs and 6 for their IDIs) | 5 (GSIBs and 6 for their IDIs) | ||||||||||
| 4 (NAA) | 4 (NAA) | ||||||||||
| Minimum CET1 capital ratio (introduced in 2009 in the United States) | n/a | n/a | n/a | n/a | 3.5 | 4.0 | 4.5 | 4.5 | 4.5 | 4.5 | 4.5 |
| Phase-in of deductions from CET1 (including amounts exceeding the limit for deferred tax assets, mortgage servicing rights, and financials) | n/a | n/a | n/a | n/a | n/a | 20.0 | 40.0 | 60.0 | 80.0 | 100.0 | 100.0 |
| Capital conservation buffer g | n/a | n/a | n/a | n/a | n/a | n/a | n/a | 0.625 | 1.25 | 1.875 | 2.5 |
| Countercyclical capital buffer for AA banks (discretionary, 0.0% to 2.5%) | n/a | n/a | n/a | n/a | n/a | n/a | n/a | 0.625 | 1.25 | 1.875 | 2.5 |
| Capital surcharge for GSIBs h | n/a | n/a | n/a | n/a | n/a | n/a | n/a | 0.25 to 4.5 | 0.50 to 4.5 | 0.75 to 4.5 | 1 to 4.5 |
| Capital instruments that no longer qualify as CET1 or Tier 1 capital i | n/a | n/a | n/a | n/a | n/a | 80 | 60 | 40 | 20 | 0 | 0 |
Note: AA = advanced approaches, CET1 = common equity Tier 1, GSIB = global systemically important bank, IDI = insured depository institution, n/a = not applicable, NAA = non-advanced approaches. a Basel I was finalized in July 1988 and phased in over the period 1988–1992; it became fully effective in 1992 for all US banks. For the 1988–2010 period, see Federal Register 1989. b US banking regulators published a final Basel II rule in December 2007 with a phase-in and it did not become effective until 1 April 2008. See Federal Register 2007. US federal banking agencies chose not to apply Basel II to all US banks, but only to the very largest, internationally active "core" US banks. c US banking regulators published the final rule in June 2012 that became effective 1 January 2013, with revisions to certain capital requirements for trading positions and securitizations. See Federal Register 2012d. d US banking regulators issued a final rule in July 2013 implementing Basel III; the rule became effective for AA banks, those with more than $250 billion in assets or more than $10 billion of on-balance-sheet foreign exposures, on 1 January 2014, and for NAA banks on 1 January 2015. See Federal Register 2013. The Collins Floor, required by the Dodd-Frank Act, established a firm's minimum capital ratio as the lower of its standardized-approach and advanced-approaches ratios, which include both minimum capital standards and the capital conservation buffer. e The Tier 1 leverage ratio is the ratio of Tier 1 capital to on-balance-sheet assets less items deducted from Tier 1 capital. The leverage ratio applies to all banks, and must be at least 4 percent for an institution to be adequately capitalized and 5 percent to be well capitalized. The supplementary leverage ratio only applies to AA banks and is the ratio of Tier 1 capital to both on-balance-sheet and selected off-balance-sheet assets, or leverage exposure. f Leverage ratio for AA bank holding companies is based on both on-balance-sheet and off-balance-sheet items, while only on-balance-sheet items are included for NAA bank holding companies. g A bank's capital conservation buffer of 2.5 percent (on top of each risk-based ratio) will equal the lowest of the following three amounts: (1) a bank's CET1 ratio minus 4.5 percent; (2) a bank's Tier 1 risk-based capital ratio minus 6 percent; (3) a bank's total risk-based capital ratio minus 8 percent. Failure to meet these requirements results in restrictions on payouts of capital distributions and discretionary bonus payments to executives. h GSIBs calculate their surcharges using two methods and use the higher of the two surcharges. The first method is based on the framework agreed to by the Basel Committee on Banking Supervision and considers a GSIB's size, interconnectedness, cross-jurisdictional activity, substitutability, and complexity. The second method uses similar inputs, but is calibrated to result in significantly higher surcharges and replaces substitutability with a measure of the firm's reliance on short-term wholesale funding. i Basel III revised the regulatory capital treatment for Trust Securities, requiring them to be partially transitioned from Tier 1 capital into Tier 2 capital in 2014 and 2015, until fully excluded from Tier 1 capital in 2016, and partially transitioned and excluded from Tier 2 capital beginning in 2016. The exclusion from Tier 2 capital starts at 40 percent on January 1, 2016, increasing 10 percent each year until the full amount is excluded from Tier 2 capital beginning on 1 January 2022.
Like Table 1, Table 3 reveals the growing complexity of regulatory capital requirements since Basel I, especially after US banking regulators issued the final rule regarding the Basel III implementation in July 2013. Basel III regulation intends to strengthen the definition of regulatory capital, increase the minimum risk-based capital requirements for all banks, and modify the requirements for how banks calculate risk-weighted assets. It also retains the generally applicable leverage ratio requirement that banking regulators believe to be a simple and transparent measure of capital adequacy that is credible to market participants and ensures that a meaningful amount of capital is available to absorb losses. It includes both "advanced approaches" for determining the risk weight of assets for the largest internationally active banking organizations and a standardized approach that will apply to all banking organizations, except small bank holding companies (BHCs) with less than $500 million in assets. Basel III regulation became effective for advanced-approaches banks on 1 January 2014, and on 1 January 2015 for non-advanced-approaches banks. Also, advanced-approaches banks have to calculate standardized-approach RWAs in addition to advanced-approaches RWAs for purposes of applying the "Collins Floor", which establishes a bank's minimum capital ratios as the lower of its standardized-approach and advanced-approaches ratios.
Under Basel III, there are several new and more stringent capital requirements, as well as different capital requirements for banks of different sizes and systemic importance. In particular, there is a new CET1 capital ratio set at 4.5 percent of risk-based assets. The Tier 1 capital ratio is set at 6 percent (an increase from 4 percent), while the total capital ratio remains at 8 percent. The capital requirements are more stringent for the advanced-approaches banks and a subset of those banks identified as GSIBs. Indeed, for GSIBs the sum of the minimum total capital, the capital conservation buffer, the countercyclical capital buffer, and the GSIB surcharge can be as high as 17.5 percent of risk-based assets. The Federal Reserve Board (FRB) in July 2015 established the methods that US GSIBs will use to calculate a risk-based capital surcharge, which is calibrated to each firm's overall systemic risk. In particular, the GSIBs are required to calculate their surcharges under two methods and use the higher of the two. The first method is based on the framework that was agreed to by BCBS and considers a GSIB's size, interconnectedness, cross-jurisdictional activity, substitutability, and complexity. The second method uses similar inputs, but it is calibrated to result in significantly higher surcharges and replaces substitutability with a measure of the bank's reliance on short-term wholesale funding. The surcharges are being phased in – implementation began on 1 January 2016, and it will become fully effective on 1 January 2019.
Table 4 provides information on the various components of regulatory capital that are associated with the different required capital ratios under the US implementation of the Basel Capital Adequacy Standards. Different countries were free to implement the Basel Capital Adequacy Standards as they saw fit, given that Basel III provided guidelines rather than strict rules for the bank regulatory authorities in those countries implementing it. In the US, Basel III implementation brought major changes in the components of capital. In particular, banking regulators now consider the new capital measure, CET1 capital, to be the most loss-absorbing form of capital. The new emphasis on CET1 no doubt reflects the fact that, as the banking crisis emerged, market participants chose to focus more on capital measures that reflected loss-absorbing capital than on the official regulatory measures. CET1 includes qualifying common stock, retained earnings, certain accumulated other comprehensive income (AOCI) elements (if the bank does not make an AOCI opt-out election) plus or minus regulatory deductions or adjustments as appropriate, and qualifying CET1 minority interests. The banking regulators expect the majority of CET1 capital to be in the form of common voting shares. Non-advanced-approaches banks were allowed on their 31 March 2015 Call Report to make a permanent, onetime opt-out election, enabling them to calculate regulatory capital without AOCI. Such an election neutralizes the impact of unrealized gains or losses on available-for-sale bond portfolios in the context of regulatory capital levels. For banks that did not opt out, the AOCI adjustment to CET1 capital could have a significant impact on regulatory capital ratios if significant bond portfolio appreciation or depreciation occurs.
Table 4. A Timeline of US Regulatory Capital Components.
| Regulatory Capital Components | Basel I a | Basel II b | Basel II.5 c | Basel III d | |
|---|---|---|---|---|---|
| 1991–1992 | 1993–2010 | 2011 | 2012 | 2013 to as of 1 January 2019 | |
| Tier 1 capital (old) | Common equity + preferred stock + qualifying hybrids + minority interests − (goodwill + other intangibles, except for MSRs, PCCR, and DTAs) | n/a | |||
| Tier 2 capital (old) | Undisclosed reserves + assets revaluation reserves + general provisions/general loan loss reserves + preferred stock + qualifying hybrids + subordinated debt | n/a | |||
| Tier 3 capital (old) | n/a | n/a | Short-term subordinated debt, solely to support the market risks in the trading book e | n/a | |
| CET1, going-concern capital (new) | n/a | n/a | n/a | n/a | Common stock and retained earnings ± limited accumulated other comprehensive income items for opt-out banks (or accumulated other comprehensive income for non-opt-out and advanced-approaches banks) ± deductions and adjustments + qualifying CET1 minority interest − (goodwill + deferred tax assets + other intangibles) |
| Additional Tier 1 capital (AT1), going-concern capital (new) | n/a | n/a | n/a | n/a | Noncumulative perpetual preferred stock, including surplus + SBLF & TARP (bank issued) + qualifying Tier 1 minority interest − certain investments in financial institutions |
| Tier 2 capital, gone-concern capital (new) | n/a | n/a | n/a | n/a | Limited allowance for loan and lease losses + preferred stock and subordinated debt + qualifying Tier 2 minority interest − Tier 2 investments in financial institutions |
| Total capital (CET1 capital + AT1, or Tier 1 capital, + Tier 2 capital) | n/a | n/a | n/a | n/a | All of the above items with limits eliminated on subordinated debt and limited-life preferred stock in Tier 2 capital and no limit on Tier 2 capital |
| Capital conservation buffer (CCB) (new) | n/a | n/a | n/a | n/a | CET1 (CCB ratio must be in excess of CET1, Tier 1 and total capital ratios by at least 2.5% to avoid limits on capital distributions and certain discretionary bonus payments) |
| Countercyclical capital buffer (new) | n/a | n/a | n/a | n/a | CET1 |
| Capital surcharge for global systemically important banks (new) | n/a | n/a | n/a | n/a | CET1 |
| Leverage capital | Tier 1 (old) | Tier 1 (old) | Tier 1 (old) | Tier 1 (old) | CET1 + AT1 (new Tier 1) |
Note: CET1 = common equity Tier 1, DTA = deferred tax assets, MSR = mortgage servicing rights, n/a = not applicable, PCCR = purchased credit card receivables, SBLF = small business lending fund, TARP = troubled asset relief program. a See Federal Register 1989. b See Federal Register 2007. c See Federal Register 2012d. d See Federal Register 2013. e For the rule introducing Tier 3 capital, see Federal Register 1996.
Unfortunately, this is not the end of the story. Fully describing what counts as regulatory capital demonstrates the complexity that is associated with calculating capital that complies with the regulatory requirements. Highlighting this complexity also reveals the difficulties that researchers must confront when they assess how changes in capital requirements affect bank behavior. For example, banks may respond differently to capital requirements depending on differences in both the level of existing capital and the composition of the existing components of that capital.
Banks must fully deduct several items from CET1 capital, such as goodwill, deferred tax assets that arise from a net operating loss and tax credit carry-forwards, other intangible assets (except for mortgage servicing assets), gains on sale of securitization exposures, and certain investments in another financial institution's capital instruments. Banks also must consider threshold deductions for three specific types of assets: mortgage servicing assets, deferred tax assets that are related to temporary timing differences, and significant investments in another unconsolidated financial institution's common stock. Generally, banks must deduct, by category, the amount of exposure to these types of assets that exceeds 10 percent of a base CET1 capital calculation. In addition, there is a 15 percent aggregate limit on these three threshold deduction items in CET1.
Additional non-CET1 capital includes qualifying noncumulative perpetual preferred stock, bank-issued Small Business Lending Fund and Troubled Asset Relief Program instruments that previously qualified for Tier 1 capital, and qualifying Tier 1 minority interests, less certain investments in other unconsolidated financial institutions' instruments that would otherwise qualify as additional Tier 1 capital. Tier 2 capital includes the allowance for loan and lease losses up to 1.25 percent of risk-weighted assets, qualifying preferred stock, subordinated debt, and qualifying Tier 2 minority interests, less any deductions in the Tier 2 instruments of an unconsolidated financial institution. Previous limits on term subordinated debt, limited-life preferred stock, and the amount of Tier 2 capital that can be included in total capital no longer apply. Non-qualifying capital instruments issued before 9 May 2010, by banks with less than $15 billion in assets (as of 31 December 2009) are grandfathered, with the exception that grandfathered capital instruments cannot exceed 25 percent of Tier 1 capital.
In assessing the financial condition of a bank, the denominator in the risk-based capital ratio is as important as the numerator, if not more so. As noted earlier, Basel I was the first capital standard based on RWAs. Then, in response to the growing importance of trading activities of large banks, Basel I was amended in 1996 to expand capital requirements to include capital charges for market risk. Then again, Basel II.5 added capital charges for certain types of trading activities by changing the calculation of risk weights for the trading book. More generally, as compared to Basel I, Basel II and II.5 provided for more detailed calculations of the risk-sensitivity of banks. Indeed, according to Andrew Haldane, "[For] a large, representative bank using an advanced internal set of models to calibrate capital… [its] number of risk buckets has increased from around seven under Basel I to, on a conservative estimate, over 200,000 under Basel II".
In Basel III, there are two general approaches to RWAs. The standardized approach is generally designed for community banks, while the advanced approach is used by larger, more complex banks. The standardized approach applies to BHCs with $500 million or more in consolidated assets. Risk-weighted assets consist of credit-risk RWAs plus market-risk RWAs (if applicable). Credit-risk RWAs include risk-weighted assets for general credit risk, cleared transactions, default fund contributions, unsettled transactions, securitization exposures, and equity exposures. General credit risk involves the consideration of general risk weights, off-balance-sheet exposures, over-the-counter derivative contracts, cleared transactions, guarantees, credit derivatives, and collateralized transactions. Since the introduction of the risk-weighting system in the United States in the early 1990s, the general process of risk weighting assets has not changed. However, the movement from Basel I to Basel III has brought several specific changes in risk weights.
Table 5 shows that the standardized approach for Basel III involves risk weights other than the 0, 20, 50, and 100 percent categories that were initially implemented for Basel I. The Basel III risk-weighting categories allow for more detailed risk weights, and the weights now range from a low of 0 to a high of 150 percent. The risk weight for exposures to, and portions of exposures that are directly and unconditionally guaranteed by, the US government, its agencies, and the Federal Reserve is zero percent. The risk weight for high-volatility commercial real estate loans is 150 percent, up from 100 percent under Basel I. Section 939 of the Dodd-Frank Act directs the banking regulators to remove regulatory references to external credit ratings from regulations. This provision was a legislative response to the failure of the ratings to adequately indicate the riskiness of various securities. That failure affected the ability to assess the riskiness of banks and other entities leading up to the 2007–2009 financial crisis.
Table 5. Basel I and Basel III: US Risk Weights for On-Balance-Sheet and Off-Balance-Sheet Items for the Standardized Approach.
| Selected Items | Existing Basel I–Based Risk Weights a | US Basel III Final Rule Standardized Risk Weights b | ||
|---|---|---|---|---|
| Cash | 0% | 0% | ||
| Exposures to, and portions of exposures that are directly and unconditionally guaranteed by, the US government, its agencies, and the Federal Reserve | 0% | 0% | ||
| Exposures to foreign governments and their central banks | 0% for direct and unconditional claims on Organisation for Economic Co-operation and Development (OECD) governments 20% for conditional claims on OECD governments 100% for claims on non-OECD governments that entail some degree of transfer risk |
Risk weight depends on the sovereign's OECD | ||
| country risk classification (CRC) | ||||
| Risk weight | ||||
| Sovereign CRC | 0–1 | 0% | ||
| 2 | 20% | |||
| 3 | 50% | |||
| 4–6 | 100% | |||
| 7 | 150% | |||
| OECD member with no CRC | 0% | |||
| Non-OECD member with no CRC | 100% | |||
| Sovereign default | 150% | |||
| Exposures to US government-sponsored enterprises | 20% | 20% | ||
| Exposures to US public-sector entities, including US states and municipalities | 20% for general obligations | 20% for general obligations | ||
| 50% for revenue obligations | 50% for revenue obligations | |||
| Exposures to foreign public-sector entities | 20% for general obligations of states and political subdivisions of OECD countries 50% for revenue obligations of states and political subdivisions of OECD countries 100% for all obligations of states and political subdivisions of non-OECD countries |
Risk weight depends on the home country's CRC | ||
| Risk weight for general obligations | ||||
| Sovereign CRC | 0–1 | 20% | ||
| 2 | 50% | |||
| 3 | 100% | |||
| 4–7 | 150% | |||
| OECD member with no CRC | 20% | |||
| Non-OECD member with no CRC | 100% | |||
| Sovereign default | 150% | |||
| Risk weight for revenue obligations | ||||
| Sovereign CRC | 0–1 | 50% | ||
| 2–3 | 100% | |||
| 4–7 | 150% | |||
| OECD member with no CRC | 50% | |||
| Non-OECD member with no CRC | 100% | |||
| Sovereign default | 150% | |||
| Exposures to US depository institutions and credit unions | 20% | 20% | ||
| Exposures to foreign banks | 20% for all claims on banks in OECD countries 20% for short-term claims on banks in non-OECD countries 100% for long-term claims on banks in non-OECD countries |
Risk weight depends on the home country's CRC | ||
| Risk weight | ||||
| Sovereign CRC | 0–1 | 20% | ||
| 2 | 50% | |||
| 3 | 100% | |||
| 4–7 | 150% | |||
| OECD member with no CRC | 20% | |||
| Non-OECD member with no CRC | 100% | |||
| Sovereign default | 150% | |||
| Exposures to nonbank corporations | 100% | 100% | ||
| Exposures to residential mortgages | 50% for a first-lien residential mortgage exposure that is: secured by a property that is either owner-occupied or rented; made in accordance with prudent underwriting standards; not 90 days or more past due or carried in nonaccrual status; and not restructured or modified (unless restructured or modified solely pursuant to the US Treasury's Home Affordable Mortgage Program) | Retains existing capital treatment: | ||
| 100% for all other residential mortgage exposures | 50% for a first-lien residential mortgage exposure that is: secured by a property that is either owner-occupied or rented; made in accordance with prudent underwriting standards; not 90 days or more past due or carried in nonaccrual status; and not restructured or modified (unless restructured or modified solely pursuant to the US Treasury's Home Affordable Modification Program) | |||
| 100% for all other residential mortgage exposures | ||||
| Exposures to high-volatility commercial real estate loans | 100% | 150% (the definition of high-volatility commercial real estate only captures a specific subset of acquisition, development, and construction loans; not all commercial real estate loans) | ||
| Exposures to over-the-counter derivatives | Risk weight depends on counterparty category (e.g., bank, securities firm, or general corporation), subject to a 50% risk-weight ceiling | Removes the 50% risk-weight ceiling for over-the-counter derivatives | ||
| Exposures to securitizations | Ratings-based approach: risk weight depends on the external credit rating assigned to the securitization exposure | General 20% risk-weight floor for securitization exposures | ||
| Default risk weight for items not specifically assigned to a risk-weight category | 100% | 100% | ||
| Conversion factors that are used to measure the risk of off-balance-sheet items | 0–100% | 0–100% | ||
a See Federal Register 1989. b See Federal Register 2013. Additional source: Davis Polk, U.S. Basel III Final Rule: Standardized Risk Weights Tool.
The advanced approach under Basel III applies to BHCs with consolidated assets that are greater than $250 billion or balance-sheet foreign exposures greater than $10 billion. These banks are required to determine compliance with minimum capital requirements based on the lower of the capital ratios that were calculated under the standardized and advanced approaches. Using the advanced approach, risk-weighted assets are the sum of credit-risk RWAs, market-risk RWAs (if applicable), and operational RWAs. Credit-risk RWAs include risk-weighted assets for general credit risk, securitization exposures, and equity exposures. General credit risk refers to wholesale and retail RWAs, as well as the counterparty credit risk of repo-style transactions, eligible margin loans, over-the-counter derivative contracts, cleared transactions, unsettled transactions, guarantees, and credit derivatives. Market-risk RWAs – which apply only to BHCs that have aggregate trading assets and liabilities equal to either 10 percent or more of total assets or at least $1 billion – are based on the following risk categories: interest rate, credit spread, equity price, foreign exchange, and commodity price. Operational-risk RWAs have the same basic RWA formula as that of market risk.
How US Bank Capital Regulation Has Grown Increasingly Complex Since 1970
Herring argues that 75 percent of the various capital requirements for US GSIBs could be eliminated without weakening capital regulation, and offers that as evidence of the growing complexity of US capital requirements. An alternative way to view the growing complexity embodied in US capital adequacy standards comes from RegData 3.1. The database provides counts of the number of regulatory restrictions in the CFR, which include words, such as "may not", "must", "required", "shall", and "prohibited". More restrictions that are embodied in the CFR in principle means that banking organizations must spend more resources on compliance. In the CFR, Title 12 concerns banks and banking. Parts 1–199 concern the Office of the Comptroller of the Currency (OCC), parts 200–299 concern the Federal Reserve System (FRS) and parts 300–399 concern the Federal Deposit Insurance Corporation (FDIC). The parts of the CFR that concern commercial bank capital requirements in Title 12 include "Part 3 – Capital Adequacy Standards", "Part 217 – Capital Adequacy of BHCs, S&L Holding Companies, and State Member Banks" for the FRS and "Part 324 – Capital Adequacy of FDIC-Supervised Institutions" and "Part 325 – Capital Maintenance" for the FDIC. We can present measures of the rising complexity of bank capital requirements by dividing the total number of regulatory restrictions that concern bank capital by the total number of regulatory restrictions, for each agency.
Figure 1 depicts the fraction of regulatory restrictions for the FDIC, OCC and Federal Reserve that concern capital requirements since 1970. The figure shows that the fraction of restrictions that concern bank capital for the FDIC and OCC has increased greatly relative to what existed under Basel I, and now equals nearly 25 percent. For the Federal Reserve, almost all of the regulatory restrictions have come since Basel III, and by 2017, exceeded 10 percent.
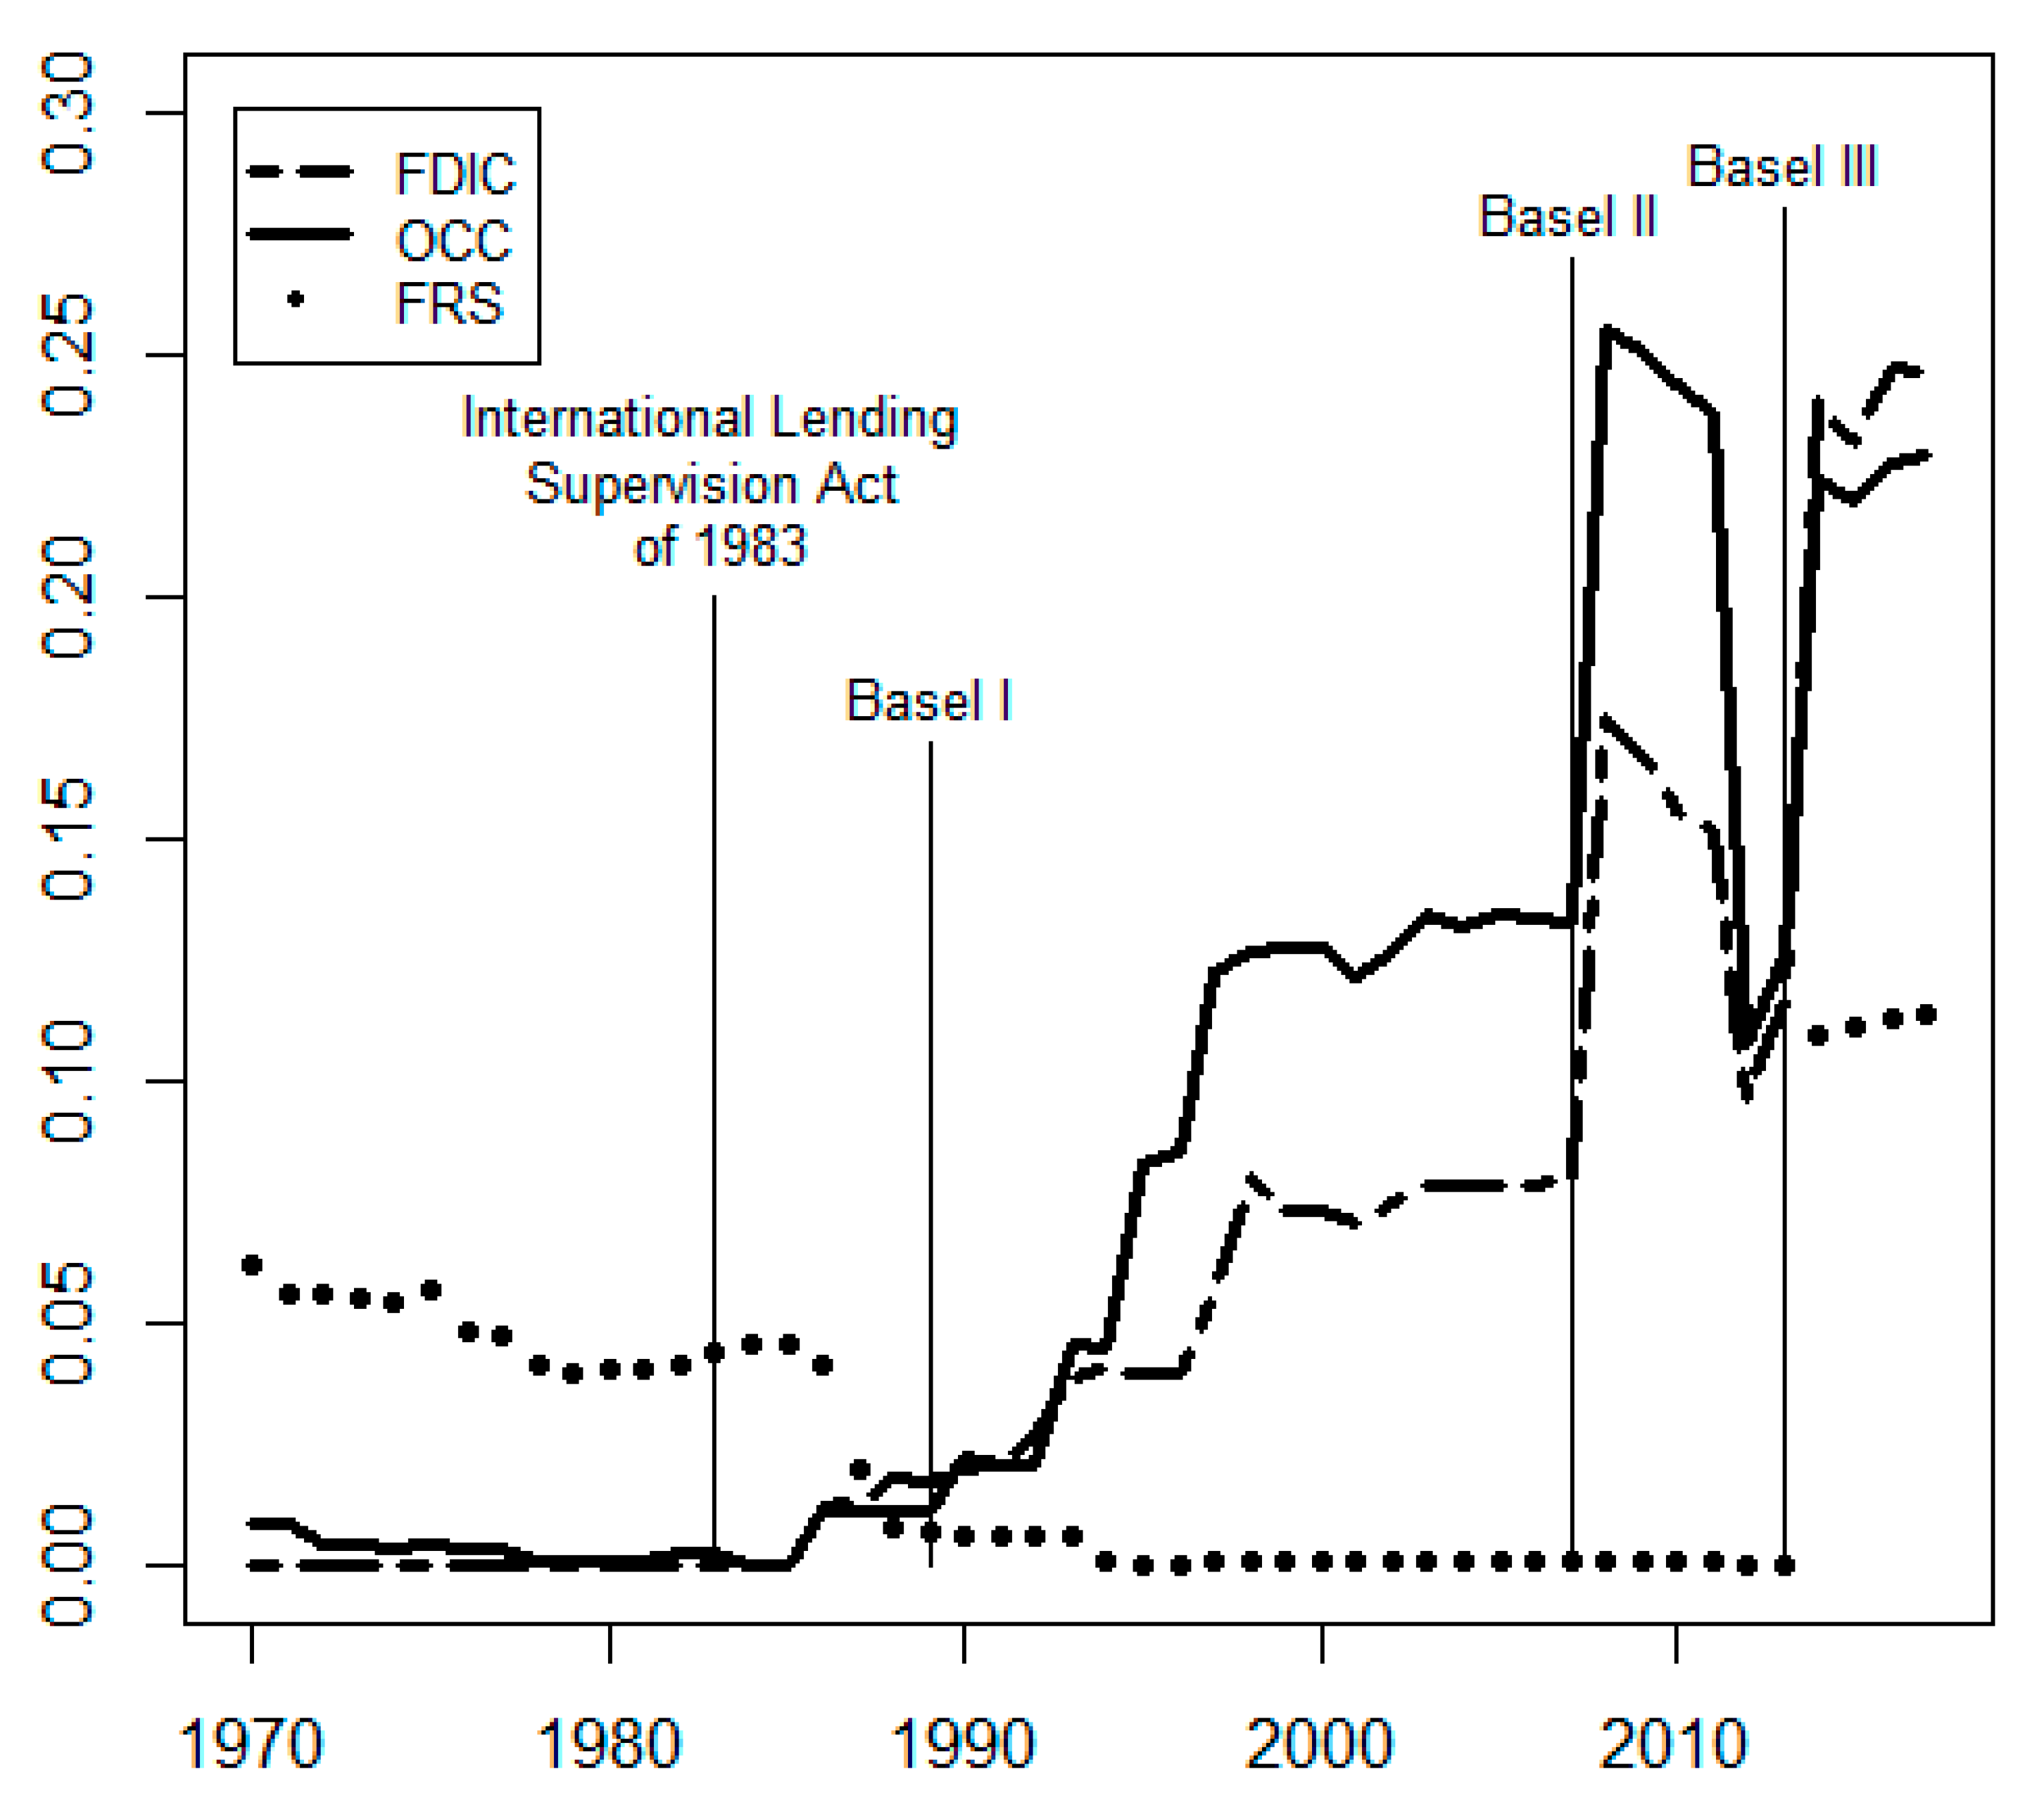
Figure 1. The Fraction of Regulatory Restrictions Arising from Bank Capital Requirements, 1970–2017.
As a suggestive exercise, we estimate how capital requirements contribute to overall regulatory complexity by agency by applying Mora and Reggio's fully flexible approach to estimating average treatment effects. The idea is to estimate how many additional restrictions or word counts are on average generated by regulatory capital requirements.
Mora and Reggio show that, if the trends for the treatment and control groups are the same, the appropriate estimator for the average treatment effect for the difference-in-differences estimator under the parallel paths assumption yields the same treatment effects as the difference in double-differences estimator under the parallel growths assumption. This no longer holds if the pre-treatment dynamics for the treatment and control groups differ. They also propose a test for equal pre-treatment dynamics.
The outcome variable here is either the total number of regulatory restrictions or total word counts in the CFR, by year, for the OCC and FDIC; we exclude the Federal Reserve given that there were many years when Part 217 generated no regulatory restrictions. As a treatment variable, we use a dummy variable that equals one if the CFR part equals 3 for the OCC, or 324 or 325 for the FDIC, and equals zero otherwise. The assumption is that restrictions (or word counts) in the parts of the CFR that concern capital contribute to the total number of restrictions (or word counts), and not vice versa. As a post-treatment period, we use the period starting in 1989, when Basel I was finalized by US regulators. As an alternative, we estimate similar average treatment effects after replacing total regulatory restrictions with total word counts. Given that we do not reject the null hypothesis of equal pre-treatment dynamics, we report results for the post-treatment effects assuming parallel paths, together with the 95 percent confidence interval, from 1989–2017 in Figure 2.

Figure 2. Average Treatment Effects of Bank Capital Requirements on Regulatory Restrictions and Word Counts Since Basel I, 1989–2017.
The figure shows that the CFR parts that concern capital requirements on average generate a substantial number of restrictions relative to all other parts. For instance, Part 3, on average, generated roughly 600 (1300) more regulatory restrictions and 70,000 (150,000) extra words than other parts under Basel II after 2007 (Basel III after 2013). For comparison, the other parts of the CFR for the OCC on average generated 55 restrictions (7000 words) after 2007 and over 65 restrictions (7000 words) after 2013. Basel II and Similarly, Parts 324 and 325 for the FDIC on average generated about 300 (900) more regulatory restrictions and 40,000 (100,000) extra words than other parts under Basel II after 2007 (Basel III after 2013). For comparison, the other parts of the CFR for the FDIC on average generated about 60 restrictions (6000–7000 words) after 2007 and over 100 restrictions (11,000 words) after 2013.
Beyond the added compliance costs, regulatory complexity also can have unintended consequences including opportunities for regulatory arbitrage, which have been observed by academics long before the 2007–2009 crisis. Although the risk weights have become much more complex since the introduction of Basel I, the basic framework – setting minimum capital requirements as a fraction of RWAs with risk weights assigned to asset categories – has remained the same. At the same time, Acharya et al. argue that "risk weights are flawed measures of bank risks cross-sectionally as banks game their risk-weighted assets (cherry-pick on risky but low risk-weight assets) to meet regulatory capital requirements, which does not necessarily reduce economic leverage". Other studies find that non-risk-based measures of capital better predict bank stock returns or bank risk than risk-based measures. Moreover, Flannery observes that banks satisfied regulatory capital requirements, which rely on book values, while market valuations of capital plunged well below book values during the crisis; we examine such problems in more detail next.
Beyond US Basel Capital Regulations
US Prompt Corrective Action Requirements
In addition to the implementation of the Basel Capital Accords, US banks are subject to PCA requirements. The PCA regulatory regime was established pursuant to the Federal Deposit Insurance Corporation Improvement Act of December 1991 (FDICIA) and it became effective in December 1992. The FDICIA requires insured depository institutions (IDIs) and federal banking regulators to take "prompt corrective action" to resolve capital deficiencies at IDIs.
Table 6 shows the old and new capital ratios that are associated with the different categories calling for the various regulatory actions to resolve capital deficiencies. The major change is that a stricter measure of capital (CET1) than the previous Tier 1 capital ratio was introduced by eliminating some components that had previously counted as capital. In addition, the associated ratios for the new measure as compared to the previous measure have been increased, at least for Tier 1 capital. The new PCA ratios became effective on 1 January 2015, for all banks. As Table 6 indicates, banks are placed into one of five categories depending on their leverage and risk-based capital (RBC) ratios. Well-capitalized banks are those banks that meet all five thresholds and are not subject to formal action to maintain a specific capital level. Banks that are less than well-capitalized are subject to increasingly stringent provisions to resolve capital deficiencies as their capital ratios decline. The regulatory authorities of banks that become critically undercapitalized must within 90 days appoint a receiver or take other such actions that would better serve the purposes of PCA (and review such actions every 90 days). Lastly, the standards for determining whether a BHC is well-capitalized are not established.
Table 6. US Prompt Corrective Action (PCA), Old and New.
| PCA Threshold | Old PCA Categories (IDIs) a | New PCA Categories (IDIs) b | ||||||
|---|---|---|---|---|---|---|---|---|
| Tier 1 Leverage (%) | Tier 1 RBC (%) | Total RBC (%) | Tier 1 Leverage (%) | Tier 1 Capital (%) | Common Equity Tier 1 RBC (%) | Total RBC (%) | Supplementary Leverage Ratio (AA/IDIs only) | |
| Well capitalized | ≥5.0 | ≥6.0 | ≥10.0 | ≥5.0 | ≥8 | ≥6.5 | ≥10.0 | n/a |
| Adequately capitalized | ≥4.0 | ≥4.0 | ≥8.0 | ≥4.0 | ≥6 | ≥4.5 | ≥8.0 | ≥3 |
| Undercapitalized | <4.0 | <4.0 | <8.0 | <4.0 | <6 | <4.5 | <8.0 | <3 |
| Significantly undercapitalized | <3.0 | <3.0 | <6.0 | <3.0 | <4 | <3.0 | <6.0 | n/a |
| Critically undercapitalized | tangible equity/total assets ≤ 2% | n/a | ||||||
Note: AA = advanced approaches, IDI = insured depository institution, n/a = not applicable, RBC = risk-based capital. Tangible equity is Tier 1 capital plus non-Tier 1 perpetual preferred stock. Also, the supplementary leverage ratio becomes effective 1 January 2018. a See Federal Register 1992. b See Federal Register 2013.
What has not changed is the "critically undercapitalized" category. This may continue to pose challenges to the effectiveness of PCA. Balla et al. show that the FDIC has been adhering to the PCA in the sense that the average amount of tangible capital relative to assets for failed banks increased from –2 percent in the 1986–1992 period to 1.4 percent in the 2007–2013 period. However, they also show that the costs of closure were higher during the latter period. Cole and White report that the FDIC estimated that the cost of closure during the most recent crisis equaled 23.8 percent of total assets and estimated that about 37 percent of the $49.8 billion costs of closure was due to delaying closure of weak banks. Cole and White suggest this may reflect problems in generally accepted accounting principles (GAAP) and also that a more effective PCA reform might focus on increasing provisions, so that banks do not overstate the book value of their capital or including non-performing assets in capital ratios.
US Capital Planning and Stress Tests
Supervisory stress testing by banking regulators gained prominence during the banking crisis of 2007–2009. In particular, in 2009, banking supervisors conducted the Supervisory Capital Assessment Program (SCAP) to assess the largest bank holding companies' capital positions. SCAP presented two hypothetical macroeconomic scenarios, including one that was more adverse than what was expected for the US economy, for BHCs to use in estimating the impact on capital. The Federal Reserve publicly reported that 10 of the 19 BHCs that were included in SCAP did not meet the capital adequacy requirements under the adverse macroeconomic scenario. As a result, these BHCs were collectively required to add $185 billion in capital by the end of 2010.
Section 165(i) of the Dodd-Frank Act mandated an annual assessment by the Federal Reserve of BHCs with $50 billion or more in total consolidated assets, as well as smaller BHCs and nonbank financial institutions that are regulated by the Federal Reserve. This annual assessment includes two related programs: the Comprehensive Capital Analysis and Review (CCAR) and supervisory stress testing (DFAST). These annual stress tests look at whether the BHCs have effective capital adequacy processes and sufficient capital to absorb losses during stressful conditions, while meeting obligations to creditors and counterparties and continuing to serve as credit intermediaries.
In late 2010, the Federal Reserve – acting in part in response to the statute – initiated the CCAR exercise. As part of the exercise, the Federal Reserve evaluates institutions' capital adequacy, their internal capital adequacy assessment processes, and their individual plans to make capital distributions, such as dividend payments or stock repurchases. More specifically, CCAR specifies four mandatory elements of a capital plan: (1) an assessment of the expected uses and sources of capital over the planning horizon that reflects the BHC's size, complexity, risk profile, and scope of operations, assuming both expected and stressful conditions; (2) a detailed description of the BHC's process for assessing capital adequacy; (3) the BHC's capital policy; and, (4) a discussion of any baseline changes to the BHC's business plan that are likely to have a material impact on the BHC's capital adequacy or liquidity.
The Federal Reserve has conducted CCAR annually since its inception in 2010 for the largest BHCs. For the CCAR 2015 exercise, the Federal Reserve issued instructions on 17 October 2014, and received capital plans from 31 BHCs on 5 January 2015. Table 7 shows the banks participating in CCAR in 2015 as well as the required capital ratios. The 31 BHCs that are part of this CCAR held more than 80 percent of the total assets of all US BHCs, or $14 trillion as of the fourth quarter of 2014. The Federal Reserve reported that, in 2015, for the first time, no participating bank fell below the quantitative benchmarks that must be met in CCAR after some BHCs made onetime downward adjustments to their planned capital distributions or redemptions. However, the Federal Reserve did object to Santander's CCAR 2015 capital plan on qualitative grounds because of widespread and critical deficiencies across the BHC's capital planning processes. The Federal Reserve also objected on qualitative grounds to the capital plan of Deutsche Bank Trust Corporation because of numerous and significant deficiencies across its risk-identification, measurement, and aggregation processes; approaches to loss and revenue projection; and, internal controls.
Table 7.Comprehensive Capital Analysis and Review (CCAR) 2015 Bank Holding Companies (BHCs) and Applicable Minimum Capital Ratios.
| Advanced-Approaches BHCs in CCAR 2015 | |||
|---|---|---|---|
| American Express Company (NYC, NY, USA) | Bank of America Corporation (CHARLOTTE, NC, USA) | Bank of New York Mellon Corporation (NYC, NY, USA) | Capital One Financial Corporation (NYC, NY, USA) |
| Citigroup Inc. (NYC, NY, USA) | Goldman Sachs Group Inc. (NYC, NY, USA) | HSBC North America Holdings Inc. (NYC, NY, USA) | JPMorgan Chase & Co. (NYC, NY, USA) |
| Morgan Stanley (NYC, NY, USA) | Northern Trust Corporation (CHICAGO, IL, USA) | PNC Financial Services Group Inc. (PITTSBURGH, PA USA) | State Street Corporation (BOSTON, MA, USA) |
| U.S. Bancorp (PORTLAND, OR, USA) | Wells Fargo & Co. (SAN FRANCISCO, CA, USA) | ||
| Other BHCs for CCAR 2015 | |||
| Ally Financial Inc. (DETROIT, MI, USA) | BB&T Corporation (WINSTON SALEM, NC, USA) | BBVA Compass Bancshares Inc. (BIRMINGHAM, AL, USA) | BMO Financial Corp. (WILMINGTON, DE, USA) |
| Citizens Financial Group Inc. (NEWHAVEN, MO, USA) | Comerica Incorporated (DALLAS, TX, USA) | Deutsche Bank Trust Corporation (NYC, NY, USA) | Discover Financial Services (RIVERWOODS, IL, USA) |
| Fifth Third Bancorp (CINCINNATI, OH, USA) | Huntington Bancshares Incorporated (COLUMBUS, OH, USA) | KeyCorp (ALBANY, NY, USA) | M&T Bank Corporation (BUFFALO, NY, USA) |
| MUFG Americas Holdings Corporation (NYC, NY, USA) | Regions Financial Corporation (BIRMINGHAM, AL, USA) | Santander Holdings USA Inc. (BOSTON, MA, USA) | SunTrust Banks Inc. (ATLANTA, GA, USA) |
| Zions Bancorporation (SALT LAKE CITY, UT, USA) | |||
| Minimum capital ratios in CCAR 2015 (%) | |||
| 2014:Q4 advanced-approaches BHCs | 2014:Q4 other BHCs | 2015–2016 all BHCs | |
| Tier 1 common ratio | 5 | 5 | 5 |
| Common equity Tier 1 ratio | 4 | not applicable | 4.5 |
| Tier 1 risk-based capital ratio | 5.5 | 4 | 6 |
| Total risk-based capital ratio | 8 | 8 | 8 |
| Tier 1 leverage ratio | 4 | 3 or 4 | 4 |
DFAST – a complementary exercise to CCAR – is a forward-looking quantitative evaluation of the effect of stressful economic and financial market conditions on a bank's capital. In 2012, the Federal Reserve finalized the rules that implement the stress test requirements under the Dodd-Frank Act. All BHCs and IDIs with $10 billion or more in total consolidated assets are required to conduct an annual company-run stress test. BHCs with assets greater than $50 billion must conduct semiannual company-run stress tests and they also are subject to stress tests conducted by the Federal Reserve. The company-run tests must include three scenarios, and the institutions must publish a summary of the results. The estimated losses resulting from these tests are then subtracted from a bank's capital to determine the financial buffer that a bank has to insulate itself from shocks and losses. A bank effectively fails the tests if its capital falls below a required minimum level after the theoretical losses.
While DFAST is complementary to CCAR, both efforts are distinct testing exercises that rely on similar processes, data, supervisory exercises, and requirements. However, there are important differences between the two exercises. For CCAR, the Federal Reserve uses BHCs' planned capital actions and assesses whether a BHC would be capable of meeting supervisory expectations for minimum capital levels, even if stressful conditions emerged and the BHC did not reduce planned capital distributions. By contrast, for DFAST, the Federal Reserve uses a standardized set of assumptions that are specified in the Dodd-Frank Act stress test rules. DFAST is therefore far less detailed and less tailored to a specific BHC.
The requirements, expectations, and activities relating to DFAST and CCAR do not apply to any banking organizations with assets of $10 billion or less. In particular, community banks are not required or expected to conduct the enterprise-wide stress tests that are required of larger organizations under the capital plan rule, the rules implementing the Dodd-Frank Act stress testing requirements, or the procedures described in the stress testing guidance for organizations with more than $10 billion in total consolidated assets. As noted, BHCs with $10 to $50 billion in assets are only subject to firm-run stress tests for DFAST.
Stress testing requirements are a risk-assessment supervisory tool. The goal of stress tests conducted under the Dodd-Frank Act is to provide forward-looking information to supervisors to assist in their overall assessments of a bank's capital adequacy and to aid in identifying downside risks and the potential impact of adverse outcomes on the covered bank. Further, these stress tests support ongoing improvement in a bank's internal assessments of capital adequacy and overall capital planning. Yet, according to the Office of Inspector General of the Federal Reserve, "the Federal Reverse's Model Validation Unit does not currently conduct a formal assessment of the expertise required to validate each model or maintain an inventory to track the skills and expertise of reviewers". Furthermore, as evidence of additional problems at the Federal Reserve, "[T]he governance review findings include… a shortcoming in policies and procedures, insufficient model testing, insufficient planning and procedures to address the risks posed by potential key-personnel departures, and incomplete structures and information flows to ensure proper oversight of model risk management". These and other types of problems, such as a lack of transparency and forced homogeneity, call the usefulness of DFAST into question.
On the positive side, CCAR and DFAST may induce banks to have more capital than they would if they were subject only to the traditional capital requirements. As a result of the stress tests and other post-crisis measures, banks may have become less susceptible to financial distress, but at the same time, to the extent that such measures have associated compliance costs, they may have affected lending decisions, especially to smaller firms.
Not All Capital Ratios Are Equally Informative
Actual Capital Ratios Compared to Required Minimum Capital Ratios
A number of recent academic studies suggest that a simple equity to asset leverage ratio equal to roughly 15 percent would have benefits that are associated with reducing the effects of financial stability that equal or exceed costs associated with implementing the regulation. On the other hand, nearly all the capital adequacy guidelines set by BCBS are based on a bank's risk-weighted assets. In this section, we provide evidence that the various capital ratios imposed on banks are not equally informative about whether a bank is adequately capitalized.
The analysis proceeds by comparing the actual capital ratios to the required minimum capital ratios for some of the largest banks in the United States for every year over the period 2000–2017Q3. There are four such capital ratio comparisons: (1) the actual risk-based Tier 1 capital ratio is compared to the required minimum ratio of 4 percent from 2000 to 2012, 4.5 percent in 2013, 5.5 percent in 2014, and 6 percent in 2015 to 2017; (2) the actual risk-based total capital ratio is compared to the required minimum ratio of 8 percent; (3) the actual non-risk-based leverage ratio is compared to the minimum required ratio of 4 percent; and, (4) the actual non-risk-based tangible common equity ratio is compared to a (hypothetical) required minimum tangible common equity ratio of 4 percent. We also provide two other ratios that furnish an additional perspective on the four ratios just mentioned. These are the ratio of RWAs to total assets and the ratio of market capitalization to tangible common equity. The lower the former ratio, the less risk-based capital required, and in the latter case, a ratio greater than 1 indicates the market values a bank more than the book values indicate. Information is also provided about the averages and standard deviations for the different variables included in each of the tables as well as information about the number of banks with capital deficiencies or market-to-book values less than 1.
The calculations are made for six of the eight GSIBs and twelve other large banks with total assets greater than $50 billion, with the banks in every Appendix table ranked by asset size. Table A1 in the Appendix A shows the percentage by which the actual risk-weighted Tier 1 capital ratio exceeds the required minimum Tier 1 capital ratios for the eighteen banks from 2000 to the third quarter of 2017. All of the percentages are positive, which means that all the banks had capital buffers, or actual capital ratios, that exceeded the required minimum ratios. It is noteworthy that every bank's minimum capital buffer occurs in 2007 or earlier, while the maximum ratio occurs in 2009 or later. For nine of the eighteen banks, the minimum capital buffer occurs in 2007, which was in the midst of the banking crisis and the year before the bailout of the largest banks. Small banks were also bailed out, mainly in 2009. On the eve of the bailout, these banks more than satisfied their required minimum capital ratios. By 2015, moreover, all of the banks had more than met the new and higher capital requirement of 8.5 percent – 6 percent plus the capital conservation buffer of 2.5 percent – applicable beginning in 2019.
The situation is quite similar for the risk-weighted total capital ratio, as shown in Table A2 in the Appendix A. For every bank, the actual ratio exceeds the required minimum ratio, and by more than a trivial percentage, in each year. Importantly, just as in the case of Tier 1 capital, every bank had a positive capital buffer during 2007–2008, even though the United States was suffering the worst financial crisis since the Great Depression and it was in the midst of a severe recession. By 2015, moreover, all of the banks had sufficient capital to satisfy the minimum total capital ratio plus the capital conservation buffer of 10.5 percent.
To better understand how these banks' capital positions were changing over time, it is useful to look at the ratio of RWAs to total assets. Table A3 in the Appendix A presents this ratio in percentage terms for the eighteen banks for the years 2000–2017. Risk weighting makes it easier to exceed minimum capital ratios by lowering the total assets against which capital requirements are applied. The vast majority of the percentages in Table A3 are less than 100 percent because of the type of assets the banks have chosen to hold. After the risk-weighting formula is applied, almost all the banks' asset totals are less than the actual amount of assets. For example, for Citigroup, the ratio was 72 percent in 2000, and then trended downwards to a low of 51 percent in both 2008 and 2010. In the following two years, the ratio barely increased to 52 percent before increasing thereafter. In the two years when the ratio of risk-weighted assets to total assets was 51 percent, Citigroup did not need to have capital to back 49 percent of its assets. The decline in RWAs relative to total assets enabled the Tier 1 and total capital ratios to be higher with the same amount of capital then otherwise.
Table A4 in the Appendix A shows the actual non-risk-based leverage ratio minus the required minimum leverage ratio. All the capital buffers are positive. However, in contrast to Table A1 and Table A2, the percentages for most of the banks' capital buffers are smaller. In particular, the three largest banks had the smallest capital buffers in any year over the entire period, with the exception of BNY Mellon, State Street, and BB&T. In 2007, the figures were 2.00 percent for JPMorgan Chase, 1.04 percent for Bank of America, and 0.03 percent for Citigroup.
Another non-risk-based capital ratio is the tangible common equity ratio. Table A5 in the Appendix A shows the actual tangible common equity ratio minus a (hypothetical) required minimum tangible common equity ratio of 4 percent. This particular ratio, in which the numerator is based on the actual owner-contributed common equity less the actual intangible assets of a bank, is tangible common equity divided by tangible assets. The benefits of this measure lie in the fact that (1) it is less susceptible to guesswork or questionable manipulation, (2) market participants paid more attention to it than to other measures during the recent banking crisis, and (3) it is highly correlated to a market-value measure of capital. Regarding the latter point, based on the data for the banks in the Appendix tables, the correlation coefficient between tangible common equity capital and the market value of capital is 0.84 and it is highly statistically significant. Unlike Table A1, Table A2, Table A3 and Table A4, Table A5 contains quite a few negative percentages, as denoted by the cells with numerical values in parentheses. Moreover, in 2008, if tangible common equity had been the required capital measure for the minimum leverage ratio, nine banks would not have had enough capital to meet this minimum ratio. In 2007, one year before the bank bailout, neither Bank of America nor Citigroup would have met such a ratio. All of these banks received capital injections from the federal government. Importantly, according to Demirguc-Kunt et al., it is found that "the relationship between stock returns and capital is stronger when capital is measured by the leverage ratio rather than the risk-adjusted capital ratio … [and] higher quality forms of capital, such as … tangible common equity, [was] more relevant". In addition, Haldane points out that in terms of "pre-crisis predictive power … [m]easures of risk-weighted capital are statistically insignificant, while the leverage ratio is significant at the 1% level". He adds that "[u]sing different methods and samples, other studies support the predictive superiority, or at least equivalence, of leverage over capital ratios.
Table A6 in the Appendix A presents the market capitalization to actual tangible common equity ratios for the eighteen banks. A ratio greater than 1 means the market value of a bank is greater than indicated by its book value. The table shows that every bank had a ratio greater than 1 in every year from 2000 to 2006. In 2008 and 2009, during the midst of the banking crisis, nine banks had ratios less than 1. The three largest banks had ratios less than 1 in 2008, while two of these banks also have ratios less than 1 in 2009. In the latter year, JPMorgan had a ratio of 1.04. During the period 2009 to 2017, only six banks had ratios that were greater than 1 every year, and those same banks also had ratios greater than 1 throughout the entire period from 2000 to 2017. Moreover, three of the banks – Bank of America, Citigroup, and Regions – had ratios less than 1 every year from 2008 to 2015.
As noted earlier, the data regarding capital ratios clearly indicate that whether banks have too little or excess capital depends on the specific capital ratio on which one focuses and whether the capital ratio is risk-based or not. Some of the ratios may indicate that a bank has sufficient capital to satisfy regulatory requirements, whereas other ratios may indicate that there is a deficiency in capital. This means that a higher regulatory capital ratio being imposed on banks may or may not affect bank behavior. To determine the outcome, one must know the specific ratio that regulators choose to increase. Importantly, in the aggregate, the market reveals that all ratios are not equally revealing about a bank's actual capital adequacy, as market participants pay more attention to some ratios than others when assessing whether a bank is adequately capitalized. Indeed, according to Graeme Wearden of The Guardian, the tangible common equity ratio … takes a more conservative view than other measures, such as Tier 1 capital ratios, and has become an increasingly important way of assessing the banking sector as the financial crisis … [in 2007–2008] deepened. Douglas J. Elliott, moreover, states that "[c]ommon stock investors, who have the lowest repayment priority, have focused intensely at times during the recent financial crisis on the most conservative measure, tangible common equity". He adds that "… investors recognize that they [intangible assets] are particularly difficult to turn into cash in a crisis and that they can lose value if a bank's overall franchise deteriorates. For this reason, many investors prefer to treat them as worthless when evaluating capital adequacy. Such investors focus on tangible common equity".
Concluding Comments
Bank regulatory standards have been a work in progress in countries around the world. They have changed several times in recent decades, and most significantly in response to the last banking crisis. They have become ever more stringent and complex for banks of all sizes, but especially for the largest banks. This is certainly the case in the United States. In addition to the legally mandated actions that banking regulators are required to take as a bank's capital declines below specified minimum levels, regulators now subject the larger banks to new comprehensive capital analyses and supervisory stress. Yet, it is not clear whether regulators took appropriate actions in a timely manner to lessen the severity of the most recent banking crisis, nor whether the more extensive analyses and testing contribute to a safer and sounder banking system.
What is clear is that understanding what counts as capital and how capital requirements vary for banks of different asset sizes and business models has become mind-boggling, to say the least. Most importantly, our comparison of various actual capital ratios to the required minimum ratios for a select and important group of banks is quite revealing. The differences found demonstrate the lack of any clear message about whether a bank is or is not adequately capitalized.
Whether banks have too little capital or excess capital depends on the specific required capital ratio on which one focuses and whether the required capital ratio is risk-based or non-risk-based. Some ratios indicate a bank has sufficient capital; other ratios indicate the opposite. Of course, bank supervisors may prefer a regulatory regime with several binding capital ratios, including risk-weighted and unweighted ratios, based on their view that there is no unique ratio that can always help guard against effective risk.
Nonetheless, this situation contributes to confusion, and simply adding more capital requirements is not the way to promote a safer and sounder banking system. Indeed, in 2000, only three different regulatory capital requirements were imposed on banks, two of which were risk-based. However, today there are seven such requirements, six of which are risk-based. These include Tier 1 capital ratio, total capital ratio, leverage ratio (non risk-based), CET1 capital ratio, capital conservation buffer, countercyclical capital buffer, and capital surcharge for GSIBs. While beyond the scope of this review, instead of the existing complexity in the regulatory capital requirements, it may be better to focus to a far greater degree on a simpler, tangible equity leverage ratio as an appropriate capital requirement. This ratio is fairly straightforward and easily understood by market participants. In contrast, too much of a focus on the currently constructed risk-based capital ratios has all too often been misleading with respect to whether banks were adequately capitalized. More generally, financial stability depends on not just an appropriate capital ratio, but other regulatory and supervisory factors that are well beyond the scope of this review.