
Read this section for an introduction to connecting derivatives to quantities we can see in the real world. Work through practice problems 1-4.
Calculus has been called the study of continuous change, and the limit is the basic concept which allows us to describe and analyze such change. An understanding of limits is necessary to understand derivatives, integrals, and other fundamental topics of calculus.
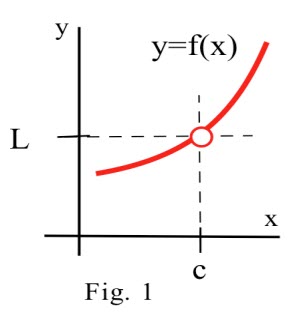
The limit of a function describes the behavior of the function when the variable is near, but does not equal, a specified number (Fig. 1). If the values of ") get closer and closer, as close as we want, to one number
get closer and closer, as close as we want, to one number  as we
take values of
as we
take values of  very close to (but not equal to) a number
  , then we
say "the limit of ") , as x approaches
, as x approaches  , is
, is  "
"  and we
write " =\mathbf{L. \"} \quad") (The symbol "
(The symbol "  " means "approaches" or "gets very close to").
") is a single number that describes the behavior (value) of f AT the point
is a single number that describes the behavior (value) of f AT the point  .
.
 \quad") is a single number that describes the behavior of
is a single number that describes the behavior of  NEAR, BUT NOT AT, the point
  .
.
If we have a graph of the function near , then it is usually easy to determine ") .
.
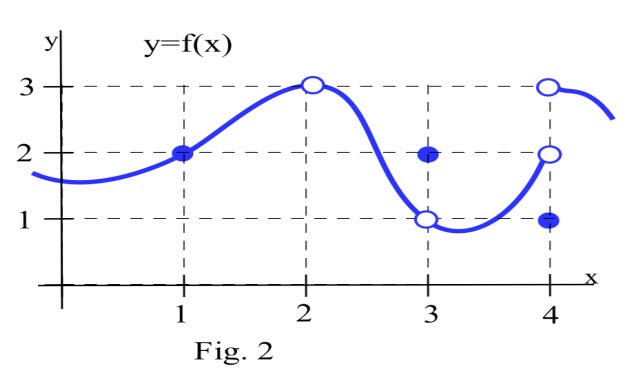
Example 1: Use the graph of ") in Fig. 2 to determine the following limits:
in Fig. 2 to determine the following limits:
(a) ")
(b) ")
(c) ")
(d) ")
Solution: (a) =2") . When
. When  is very close to 1 , the values of are very close to
  In this example, it happens
that
In this example, it happens
that =2") , but that is irrelevant for the limit. The only thing that matters is what happens for close to 1 but
, but that is irrelevant for the limit. The only thing that matters is what happens for close to 1 but  .
.
(b) ") is undefined, but we only care about the behavior of for close to 2 and not equal to 2. When
is close to 2 , the values of are close to 3 . If we restrict close enough to 2 , the values of
is undefined, but we only care about the behavior of for close to 2 and not equal to 2. When
is close to 2 , the values of are close to 3 . If we restrict close enough to 2 , the values of  will be as close to 3 as we want, so
 =3") .
.
(c) When is close to 3 (or as approaches the value 3 ), the values of are close to 1 (or approach the value 1), so =1") . For this limit it is completely irrelevant that
. For this limit it is completely irrelevant that =2") , We only care about what happens to for close to and not equal to 3.
, We only care about what happens to for close to and not equal to 3.
(d) This one is harder and we need to be careful. When is close to 4 and slightly less than 4 ( is just to the left of 4 on the -axis), then the values of ") are close to
are close to  But if is close to 4 and slightly larger than 4 then the values of are close to
  If we only know that is very close to 4, then we cannot say whether
 ") will be close to 2 or close to 3 - it depends on whether is on the right or the left side of
will be close to 2 or close to 3 - it depends on whether is on the right or the left side of  In this situation, the values are not close to a single number so we say does not exist. It is irrelevant that
 =1.") The limit, as approaches 4, would still be undefined if
The limit, as approaches 4, would still be undefined if ") was 3 or 2 or anything else.
was 3 or 2 or anything else.
Practice 1: Use the graph of in Fig. 3 to determine the following limits:

(a)
(b) ")
(c)
(d) ")
Example 2: Determine the value of  .
.
Solution: We need to investigate the values of when is close to 3. If the values get arbitrarily close to or even equal some number  , then will be the limit. One way to keep track
of both the and the values is to set up a table and to pick several values which are closer and closer (but not equal) to We can pick some values of which approach 3 from the left, say
, then will be the limit. One way to keep track
of both the and the values is to set up a table and to pick several values which are closer and closer (but not equal) to We can pick some values of which approach 3 from the left, say 
 ,
and
,
and  , and some values of which approach 3 from the right, say
 , and
, and  . The only thing important about these particular values for is that they get closer and closer to 3 without equaling
You should try some other values "close to 3" to see what happens.
. The only thing important about these particular values for is that they get closer and closer to 3 without equaling
You should try some other values "close to 3" to see what happens.
 \\ \hline 2.9 & 6.82 \\ 2.9997 & 6.9994 \\ 2.999993 & 6.999986 \\ 2.9999999 & 6.9999998 \end{array} \\ &\begin{array}{ll} & \quad
\downarrow & \qquad \qquad \quad \downarrow \\ & \quad 3 & \qquad \qquad \quad 7 \end{array}\end{aligned}") |
} \\ \\ \hline 3.1 & 7.2 \\ 3.004 & 7.008 \\ 3.0001 & 7.0002 \\ 3.000002 & 7.000004 \end{array}\\ &\begin{array}{ll}\qquad \downarrow
& \qquad \qquad \downarrow \\ \qquad 3 & \qquad \qquad 7 \end{array} \end{aligned}") |
values get closer and closer to 3, the values are getting closer and closer to  . In fact, we can get as close to 7 as we want ("arbitrarily close") by taking the values of very close
("sufficiently close") to 3.
. In fact, we can get as close to 7 as we want ("arbitrarily close") by taking the values of very close
("sufficiently close") to 3.  .
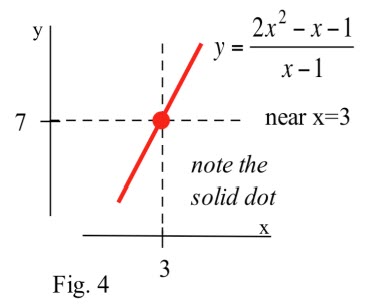
.Instead of using a table of values, we could have graphed for close to 3, Fig. 4, and used the graph to answer the limit question. This graphic approach is easier, particularly if you have a calculator or computer do the graphing
work for you, but it is really very similar to the "table of values" method: in each case you need to evaluate at many values of near 3.
You might have noticed that if we just evaluate ") , then we get the correct answer
, then we get the correct answer  That works for this particular problem, but it often fails. The next example illustrates the difficulty.
Example 3: Find  . (Same as Example 2 but with
  ).
).
Solution: You might try to evaluate =\frac{2 x^{2}-x-1}{x-1}") at
at  , but
, but  is not defined at
  . It is tempting, but wrong, to conclude that this function does not have a limit as
approaches 1.
. It is tempting, but wrong, to conclude that this function does not have a limit as
approaches 1.
Table Method: Trying some "test" values for which get closer and closer to 1 from both the left and the right, we get
 \\ \hline 0.9 & 2.82 \\ 0.9998 & 2.9996 \\ 0.999994 & 2.999988 \\ 0.9999999 & 2.9999998 \end{array} \\ &\begin{array}{ll}\qquad \downarrow
& \qquad \qquad \downarrow \\ \qquad 1 & \qquad \qquad 3 \end{array} \end{aligned}") |
 \\ \hline 1.1 & 3.2 \\ 1.003 & 3.006 \\ 1.0001 & 3.0002 \\ 1.000007 & 3.000014 \\ \quad \downarrow & \quad \downarrow \\ \quad \mathbf{1} &
\quad \mathbf{3} \end{array} \end{align}") |
The function is not defined at , but when is close to 1, the values of are getting very close to 3. We can get as close to 3 as
we want by taking very close to 1 so 
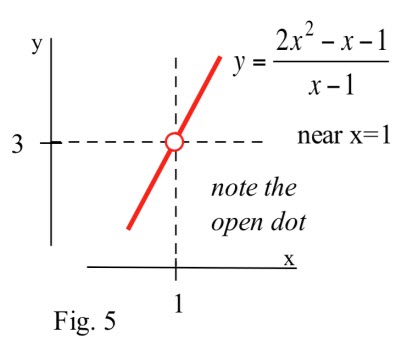
Graph Method: We can graph =\frac{2 x^{2}-x-1}{x-1}") for close to 1 , Fig. 5, and notice that whenever is close to 1 , the values of are close to
for close to 1 , Fig. 5, and notice that whenever is close to 1 , the values of are close to  is not
defined at , so the graph has a hole above , but we only care about what is doing for close to but not equal to 1.
is not
defined at , so the graph has a hole above , but we only care about what is doing for close to but not equal to 1.
Algebra Method: We could have found the same result by noting that =\frac{2 x^{2}-x-1}{x-1}=\frac{(2 x+1)(x-1)}{x-1}=2 x+1") as long as
as long as  . (If , then
  so it is valid to divide
the numerator and denominator by the factor
so it is valid to divide
the numerator and denominator by the factor  ) The "
 " part of the limit means that is close to 1 but not equal to
  , so our division step is valid and
 , the correct answer.
Source: Dave Hoffman, https://s3.amazonaws.com/saylordotorg-resources/wwwresources/site/wp-content/uploads/2011/11/2-2FunctionLimit.pdf
 This work is licensed under a Creative Commons Attribution 3.0 License.