
Read this section for an introduction to connecting derivatives to quantities we can see in the real world. Work through practice problems 1-4.
The algebra method involves algebraically simplifying the function before trying to evaluate its limit.
Often, this simplification just means factoring and dividing, but sometimes more complicated algebraic or even trigonometric steps are needed.
To evaluate a limit of a function ") as
as  approaches
  , the table method involves calculating the values of for "enough" values of very close to
so that we can "confidently" determine which value is approaching. If is well-behaved, we may not need to use very many values for . However, this method is usually used with complicated
functions, and then we need to evaluate for lots of values of .
, the table method involves calculating the values of for "enough" values of very close to
so that we can "confidently" determine which value is approaching. If is well-behaved, we may not need to use very many values for . However, this method is usually used with complicated
functions, and then we need to evaluate for lots of values of .
A computer or calculator can often make the function evaluations easier, but their calculations are subject to "round off" errors. The result of any computer calculation which involves both large and small numbers should be viewed with some suspicion. For example, the function
=\frac{\left\{(0.1)^{\mathrm{X}}+1\right\}-1}{(0.1)^{\mathrm{X}}}=\frac{(0.1)^{\mathrm{X}}}{(0.1)^{\mathrm{x}}}=1") for every value of , and my calculator gives the correct answer for some values of
for every value of , and my calculator gives the correct answer for some values of =\frac{\left\{(0.1)^{3}+1\right\}-1}{(0.1)^{3}}=1") , and
, and ") and
and ") both equal 1.
both equal 1.
But my calculator says ^{10}+1\right\}-1=0") so it evaluates
so it evaluates ") to be 0, definitely an incorrect value. Your calculator may evaluate correctly, but try
to be 0, definitely an incorrect value. Your calculator may evaluate correctly, but try ") or
or ") .
.
Calculators are too handy to be ignored, but they are too prone to these types of errors to be believed uncritically. Be careful.
The graph method is closely related to the table method, but we create a graph of the function instead of a table of values, and then we use the graph to determine which value ") is approaching.
is approaching.
In general, the algebraic method is preferred because it is precise and does not depend on which values of x we chose or the accuracy of our graph or precision of our calculator. If you can evaluate a limit algebraically, you should do so. Sometimes, however, it will be very difficult to evaluate a limit algebraically, and the table or graph methods offer worthwhile alternatives. Even when you can algebraically evaluate the limit of a function, it is still a good idea to graph the function or evaluate it at a few points just to verify your algebraic answer.
The table and graph methods have the same advantages and disadvantages. Both can be used on very complicated functions which are difficult to handle algebraically or whose algebraic properties you don't know.
Often both methods can be easily programmed on a calculator or computer. However, these two methods are very time-consuming by hand and are prone to round off errors on computers. You need to know how to use these methods when you can't figure out how to use the algebraic method, but you need to use these two methods warily.
Example 4: Evaluate (a)  and
and
(b) 
Solution: The function in each limit is the same but  is approaching a different number in each of them.
(a) Since  , we know that is getting closer and closer to 0 so the values of the
  and
and  terms get as close to 0 as we want. The numerator approaches 6 and the denominator approaches 2, so the values of the whole
function get arbitrarily close to
terms get as close to 0 as we want. The numerator approaches 6 and the denominator approaches 2, so the values of the whole
function get arbitrarily close to  , the limit.
(b) As approaches  , the numerator and denominator approach 0, and a small number divided by a small number can be almost anything - the ratio depends on the size of the top compared to the bottom. More investigation is needed.
Table Method: If we pick some values of close to (but not equal to) , we get the table
| |
 |
 |
 |
    |
    |
    |
    |
| ↓ | ↓ | ↓ | ↓ |
| -2 | 0 | 0 | -1 |
 , their ratio is getting arbitrarily close to
  which is the limit.
Graph Method: The graph of =\frac{x^{2}+5 x+6}{x^{2}+3 x+2}") in Fig. 6 shows that the values of are very close to when the -values are close to .
in Fig. 6 shows that the values of are very close to when the -values are close to .
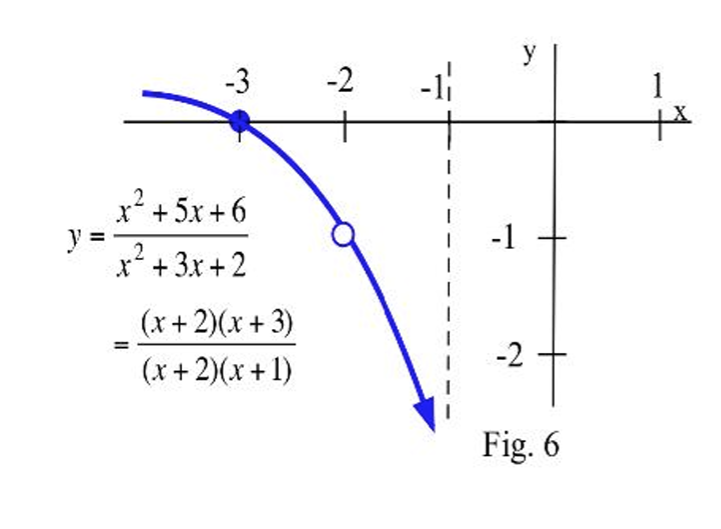
Algebra Method: =\frac{x^{2}+5 x+6}{x^{2}+3 x+2}=\frac{(x+2)(x+3)}{(x+2)(x+1)}\text{.}")
We know  so
so  , and we can divide the top and bottom by
 ") . Then
. Then =(x+3) /(x+1)") so
so  \rightarrow 1 /-1=-1") as
as  .
.

Practice 2: (a)  (b)
(b) }{t^{2}+3 t}") (c)
(c) }") .
.