This section introduces the functionality of the base-R function boxplot. Note that for some data formats, the plot function with x being a factor variable will also work.
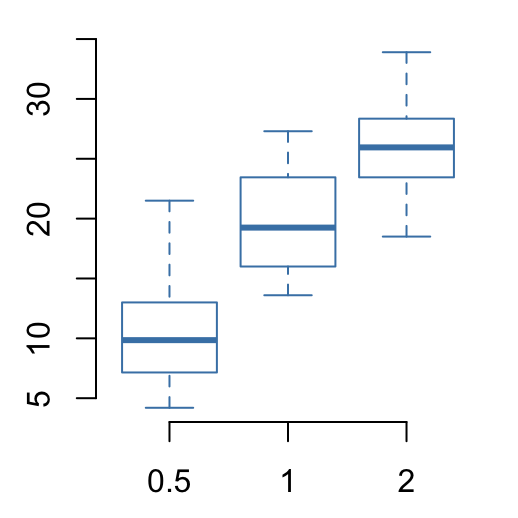
# Change the color of border using one single color
boxplot(len ~ dose, data = ToothGrowth, frame = FALSE,
        border = "steelblue")
# Change the color of border.
#  Use different colors for each group
boxplot(len ~ dose, data = ToothGrowth, frame = FALSE,
        border = c("#999999", "#E69F00", "#56B4E9"))
# Change fill color : single color
boxplot(len ~ dose, data = ToothGrowth, frame = FALSE,
        col = "steelblue")
# Change fill color: multiple colors
boxplot(len ~ dose, data = ToothGrowth, frame = FALSE,
        col = c("#999999", "#E69F00", "#56B4E9"))