Of course, the ggplot2 can also visualize time series. This section introduces the relevant ggplot2 syntax.
Key function: scale_x_date().
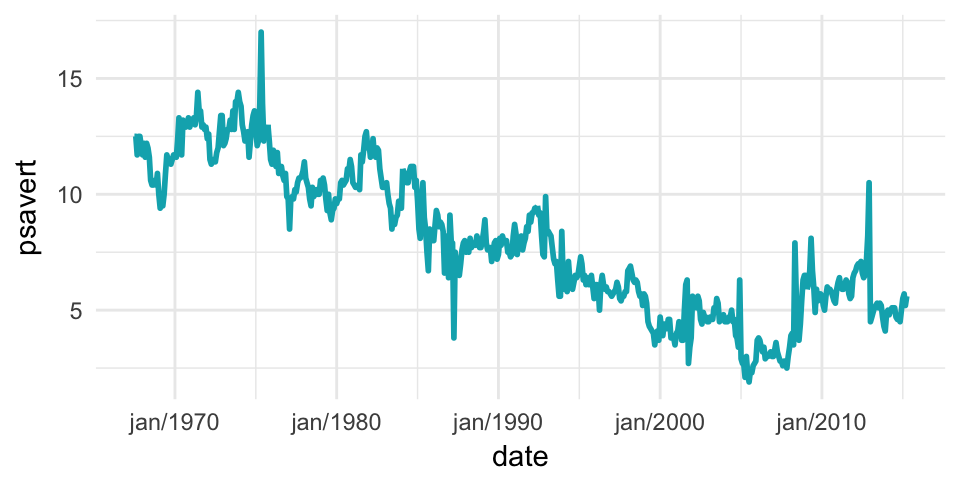
To format date axis labels, you can use different combinations of days, weeks, months and years:
%a and %A for abbreviated and full weekday name, respectively%b and %B for abbreviated and full month name, respectively%d: day of the month as decimal number%Y: Year with century.?strptime# Format : month/year p + scale_x_date(date_labels = "%b/%Y")