
Brand managers are the champions of balancing innovation and brand strategy that deliver profit, revenue, and cost efficiencies. Review this overview of how businesses as a whole use financial metrics to measure organizational performance. This review of key performance indicators introduces alternatives to evaluate a more holistic view of an organization's performance by considering different performance perspectives.
The final sample of 76 papers consists of 46 journal papers and 30 conference papers (Fig. 4), indicating a wide variety of outlets to reach the audience via operations and production-related journals in particular or in lower-ranked information systems journals.
Fig. 4

The distribution of the sampled papers per publication type (N = 76)
When considering the chronological distribution of the sampled papers, Fig. 5 indicates an increase in the uptake of the topic in recent years, particularly for conference papers but also for journal publications since 2005.
Fig. 5

The chronological distribution of the sampled papers per publication type (N = 76)
This uptake seems particularly situated in the Western world and Asia (Fig. 6). The countries with five or more papers in our sample are Germany (12 papers), the US (6 papers), Spain (5 papers), Croatia (5 papers) and China (5 papers). Figure 6 shows that business process performance measurement is a worldwide topic, with papers across the different continents. Nonetheless, a possible explanation for the higher coverage in the Western world could be due to its long tradition of measuring work (i.e., BSC origins).
Fig. 6
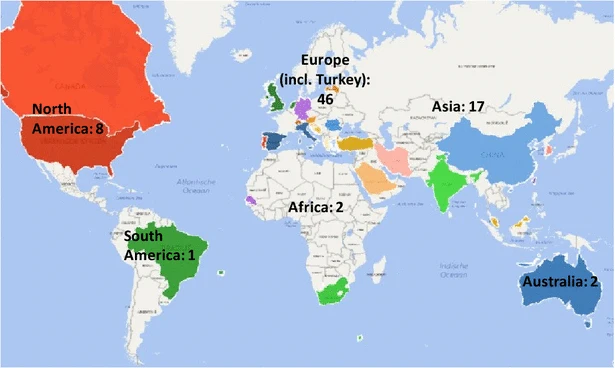
The geographical distribution of the sampled papers per continent, based on a paper's first author (N = 76)
The vast majority of the sampled papers address artifacts related to business (process) performance measurement. When looking at the research paradigm in which the papers are situated (Fig. 7), 71 % address design-science research, whereas 17 % conduct research in behavioral science and 12 % present a literature review. This could be another explanation for the increasing uptake in the Western world, as many design-science researchers are from Europe or North America.
Fig. 7
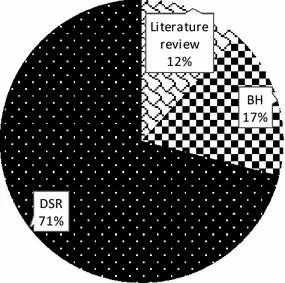
The distribution of the sampled journal papers per research paradigm (N = 76)
Figure 8 supplements Fig. 7 by specifying the research methods used in the papers. For the behavioral-science papers, case studies and surveys are equally used. The 54 papers that are situated within the design-science paradigm explicitly refer to models, meta-models, frameworks, methods and/or tools. When mapping these 54 papers to the four artifact types of March and Smith, the vast majority present (1) methods in the sense of steps to perform a task (e.g., algorithms or guidelines for performance measurement) and/or (2) models to describe solutions for the topic. The number of papers dealing with (3) constructs or a vocabulary and/or (4) instantiations or tools is much more limited, with 14 construct-related papers and 9 instantiations in our sample. We also looked at which evaluation methods, defined by Peffers et al., are typically used in the sampled design-science papers. While 7 of the 54 design-science papers do not seem to report on any evaluation effort, our sample confirms that most papers apply one or another evaluation method. Case studies and illustrative scenarios appear to be the most frequently used methods to evaluate design-science research on business (process) performance measurement.
Fig. 8
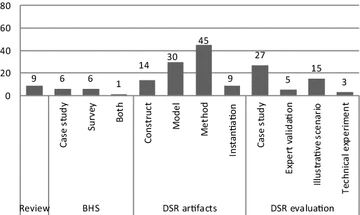
The distribution of the sampled journal papers per research method (N = 76)
The sampled design-science research papers typically build and test performance measurement frameworks, systems or models or suggest meta-models and generic templates to integrate performance indicators into the process models of an organization. Such papers can focus on the process level, organizational level or even cross-organizational level. Nonetheless, the indicators mentioned in those papers are illustrative rather than comprehensive. An all-inclusive list of generic performance indicators seems to be missing. Some authors propose a set of indicators, but those indicators are specific to a certain domain or sector instead of being generic. For instance, Table 4 shows that 36 of the 76 sampled papers are dedicated to a specific domain or sector, such as technology-related aspects or supply chain management.
Table 4 The number of sampled papers dedicated to a specific domain or sector (N = 76)
|
Domain or sector |
Number of papers |
|---|---|
|
IS/IT |
7 |
|
Supply chain |
5 |
|
Business network |
3 |
|
Manufacturing |
3 |
|
Services |
3 |
|
Automobile |
2 |
|
Banking/financial |
2 |
|
Government |
2 |
|
Health |
2 |
|
Helpdesk/maintenance |
2 |
|
Construction |
1 |
|
HR |
1 |
|
SME |
1 |
|
Strategic planning |
1 |
|
Telecom |
1 |
|
Total |
36 |
