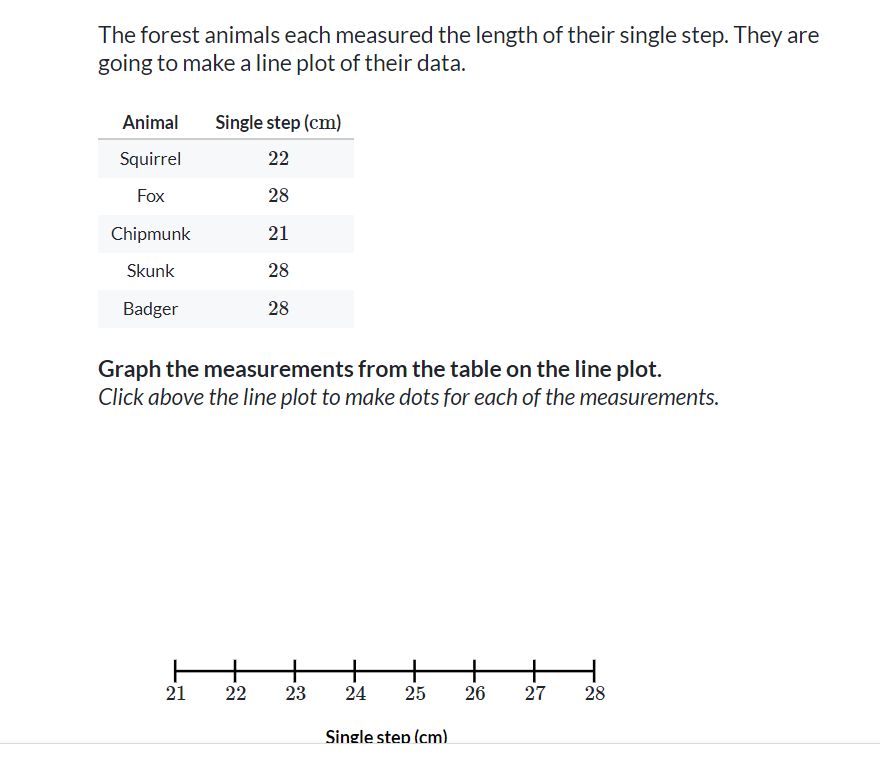
Practice: Make Line Plots
-
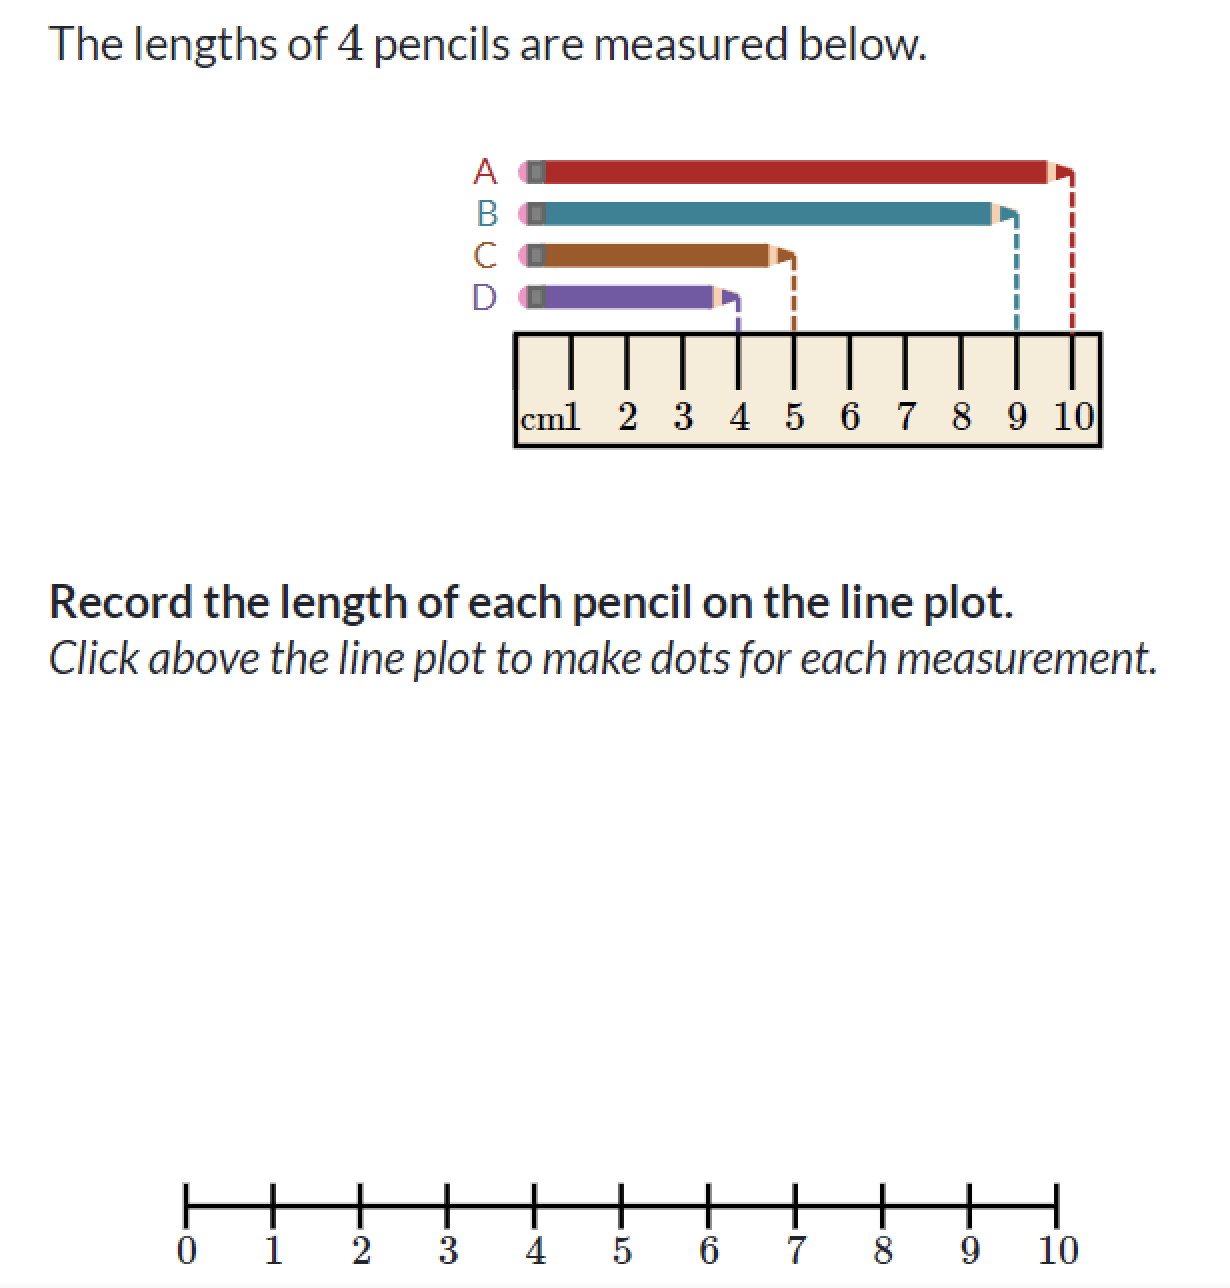
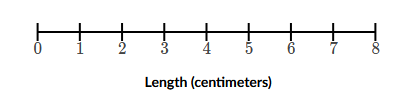
- The lengths of 4 pencils are measured below.
The students in Mrs. Dolan's second grade class each measured their hand span. The students want to make a line plot of the data.
| Student | Hand span (cm) |
| Simone | 15 |
| Lucas | 20
|
|---|
| Jose | 16 |
| Felipe | 17
|
| Carol | 17 |
Angela
| 19 |
Gabriel
| 15 |
Graph the measurements from the table on the line plot.
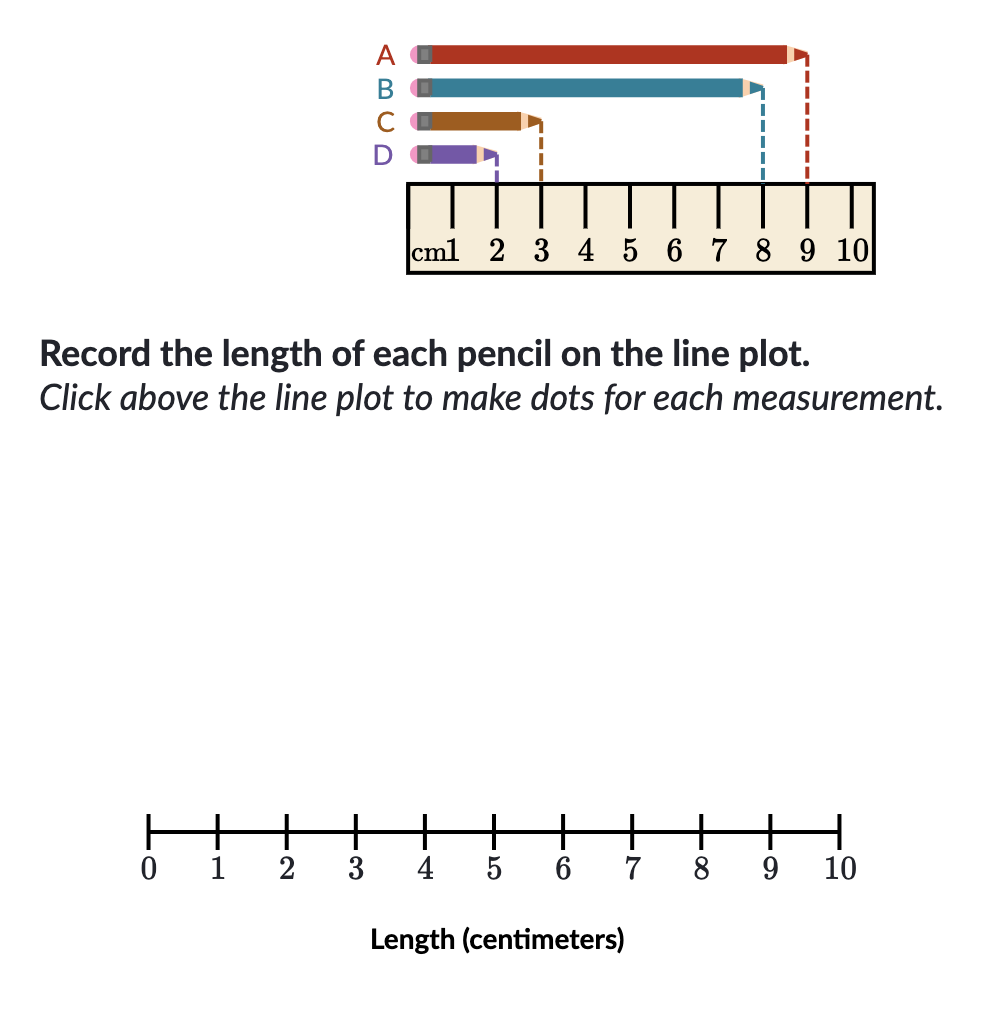
- The lengths of 4 pencils are measured below.
Science class has built volcanoes. The students are going to make a line plot of the volcano heights.
| Volcano | Height (cm) |
| Blast Em | 50 |
| King Lava | 52
|
|---|
| Erupto | 51 |
| Volcan | 53
|
| Boom | 52 |
Graph the measurements from the table on the line plot.
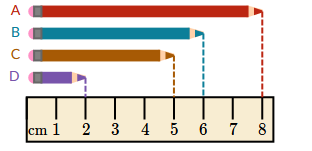
- The lengths of 4 pencils are measured below.
Record the length of each pencil on the line plot.
A park ranger counted stripes on each baby zebra. She is going to make a line plot of the data.
| Zebra | Stripes |
| Majestic | 46 |
| Speed | 49
|
|---|
| Spot | 47 |
| Zooma | 47
|
| Rayas | 46 |
Graph the measurements from the table on the line plot.
Source: Khan Academy, https://www.khanacademy.org/math/early-math/cc-early-math-measure-data-topic/cc-early-math-line-plots/e/creating-line-plots-1
 This work is licensed under a Creative Commons Attribution-NonCommercial-ShareAlike 3.0 License.