
This section is a short introduction to time series plots in R. You can use the analogy with the scatterplots where the horizontal axis is time.
The simplified format of plot() and lines() is as follow.
plot(x, y, type = "l", lty = 1)
lines(x, y, type = "l", lty = 1)# Create some variables
x <- 1:10
y1 <- x*x
y2 <- 2*y1We'll plot a plot with two lines: lines(x, y1) and lines(x, y2).
Note that the function lines() can not produce a plot on its own. However, it can be used to add lines() on an existing graph. This means that, first you have to use the function plot() to create an empty graph and then use the function lines() to add lines.
# Create a basic stair steps plot
plot(x, y1, type = "S")
# Show both points and line
plot(x, y1, type = "b", pch = 19,
     col = "red", xlab = "x", ylab = "y")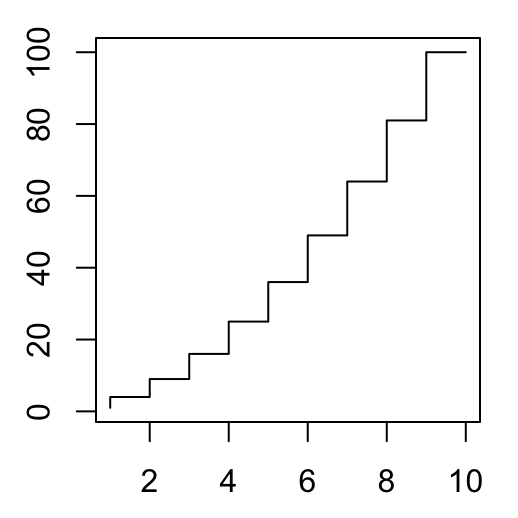

# Create a first line
plot(x, y1, type = "b", frame = FALSE, pch = 19,
     col = "red", xlab = "x", ylab = "y")
# Add a second line
lines(x, y2, pch = 18, col = "blue", type = "b", lty = 2)
# Add a legend to the plot
legend("topleft", legend=c("Line 1", "Line 2"),
       col=c("red", "blue"), lty = 1:2, cex=0.8)
Source: STHDA, http://www.sthda.com/english/wiki/line-plots-r-base-graphs This work is licensed under a Creative Commons Attribution-NonCommercial-ShareAlike 3.0 License.