
Read this section for an introduction to combinations of functions, then work through practice problems 1-9.
The graph of the greatest integer function has a break or jump at each integer value, but how many breaks can a function have? The next function illustrates just how broken or "holey" the graph of a function can be.
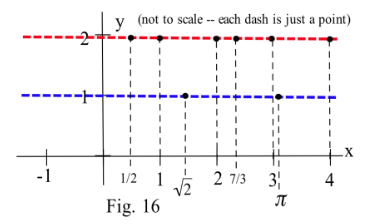
Define
 =\left\{ \begin{array}{ll}
2 & \mbox { if x is a rational number }\\1 & \mbox { if x is an irrational number} \end{array} \right.")
Then  = 2") ,
,  = 2") and
and  = 2") since 3,
5/3 and –2/5 are all rational numbers.
since 3,
5/3 and –2/5 are all rational numbers.  = 1, h(\sqrt 7 ) = 1") , and
, and  = 1") since
since  and
and  are all irrational numbers. These and some
other points are plotted in Fig. 16 .
are all irrational numbers. These and some
other points are plotted in Fig. 16 .
In order to analyze the behavior of ") the following fact about rational and irrational numbers is useful.
the following fact about rational and irrational numbers is useful.
Fact: "Every interval contains both rational and irrational numbers" or, equivalently, "If
 and
and  are real numbers and
  , then there is
(i) a rational number  between and
 ") , and
, and
(ii) an irrational number  between and
 ") ".
".
The Fact tells us that between any two places where the  = 1") (because
(because  is rational) there is a place where
 ") is 2 because there is an irrational number between any two distinct rational numbers. Similarly,
between any two places where
is 2 because there is an irrational number between any two distinct rational numbers. Similarly,
between any two places where  = 2") (because is irrational) there is a place where because there is a rational number between any two distinct irrational numbers. The graph of
is impossible to actually draw since every two points on the graph are separated by a hole. This is also an example of a function which your computer or calculator can not graph because in general it can not determine whether
an input value of is irrational.
(because is irrational) there is a place where because there is a rational number between any two distinct irrational numbers. The graph of
is impossible to actually draw since every two points on the graph are separated by a hole. This is also an example of a function which your computer or calculator can not graph because in general it can not determine whether
an input value of is irrational.
Example 7: Sketch the graph of  = \left\{ \begin{array}{ll} 2 &\mbox { if x is a rational number }\\ x
& \mbox { if x is an irrational number } \end{array} \right.")
Solution: A sketch of the graph of ") is shown in Fig. 17 .
is shown in Fig. 17 .
When is rational, the graph of looks like the "holey" horizontal line  . When is irrational, the graph of
 ") looks like the "holey"
line
looks like the "holey"
line  .
.

Practice 9: Sketch the graph of  = \left\{ \begin{array}{ll} 2 & \mbox { if x is a rational number }\\ x & \mbox { if x is an irrational number } \end{array}
\right.")