
Read these examples of how to use these different spreadsheet functions in the workplace. The learning objectives review how to use each type of function; the tables describe the syntax for each command type in detail.
The statistical IF functions we have studied thus far allow us to select cells from a targeted range using one criterion or logical test. Here, we explore statistical functions that allow us to select cells using multiple sets of criteria from a targeted range. We will begin with the COUNTIFS function.
It is easy to distinguish statistical IF functions that allow one versus multiple criteria arguments. If the IF at the end of the function name is plural, you can define multiple sets of criteria arguments. The arguments for the COUNTIFS function are established in pairs.
For example, the first arguments for the function are Criteria_range1 and Criteria1. The function will use the Criteria1 argument to select cells in the Criteria_range1 argument. A second pair of arguments, Criteria_range2 and Criteria2, can be defined to select a subset of cell locations that were selected in the Criteria_range1 and Criteria1 arguments. This process can be repeated for several pairs of criteria arguments. We will continue to work on the Portfolio Summary worksheet by adding the COUNTIFS function to count the number of poor-performing investments by investment type. The following steps explain how to add this function to the worksheet:
When creating a summary worksheet that summarizes detailed data from other worksheets, such as the Portfolio Summary worksheet in Figure 8, it is best to use statistical IF functions. If data is added to the detailed worksheet that is being summarized, the statistical IF functions will automatically include the new data in the summary worksheet. For example, suppose a row is added below Row 7 on the Investment Detail worksheet (see Figure 3.24 "Conditional Format Applied to the Range S4:T18"), and another bond investment is added. The statistical IF functions will automatically pick up the new investment and include it in the Portfolio Summary worksheet. If regular statistical functions or formulas are used, the summary worksheet can easily become inaccurate if new data is added to the detailed worksheet or if the sort order is changed.
Figure 9 shows the completed arguments for the COUNTIFS function in the Function Arguments dialog box. Notice the scroll bar that appears on the right side of the Function Arguments dialog box. This allows you to scroll through and define multiple pairs of criteria arguments for the function.
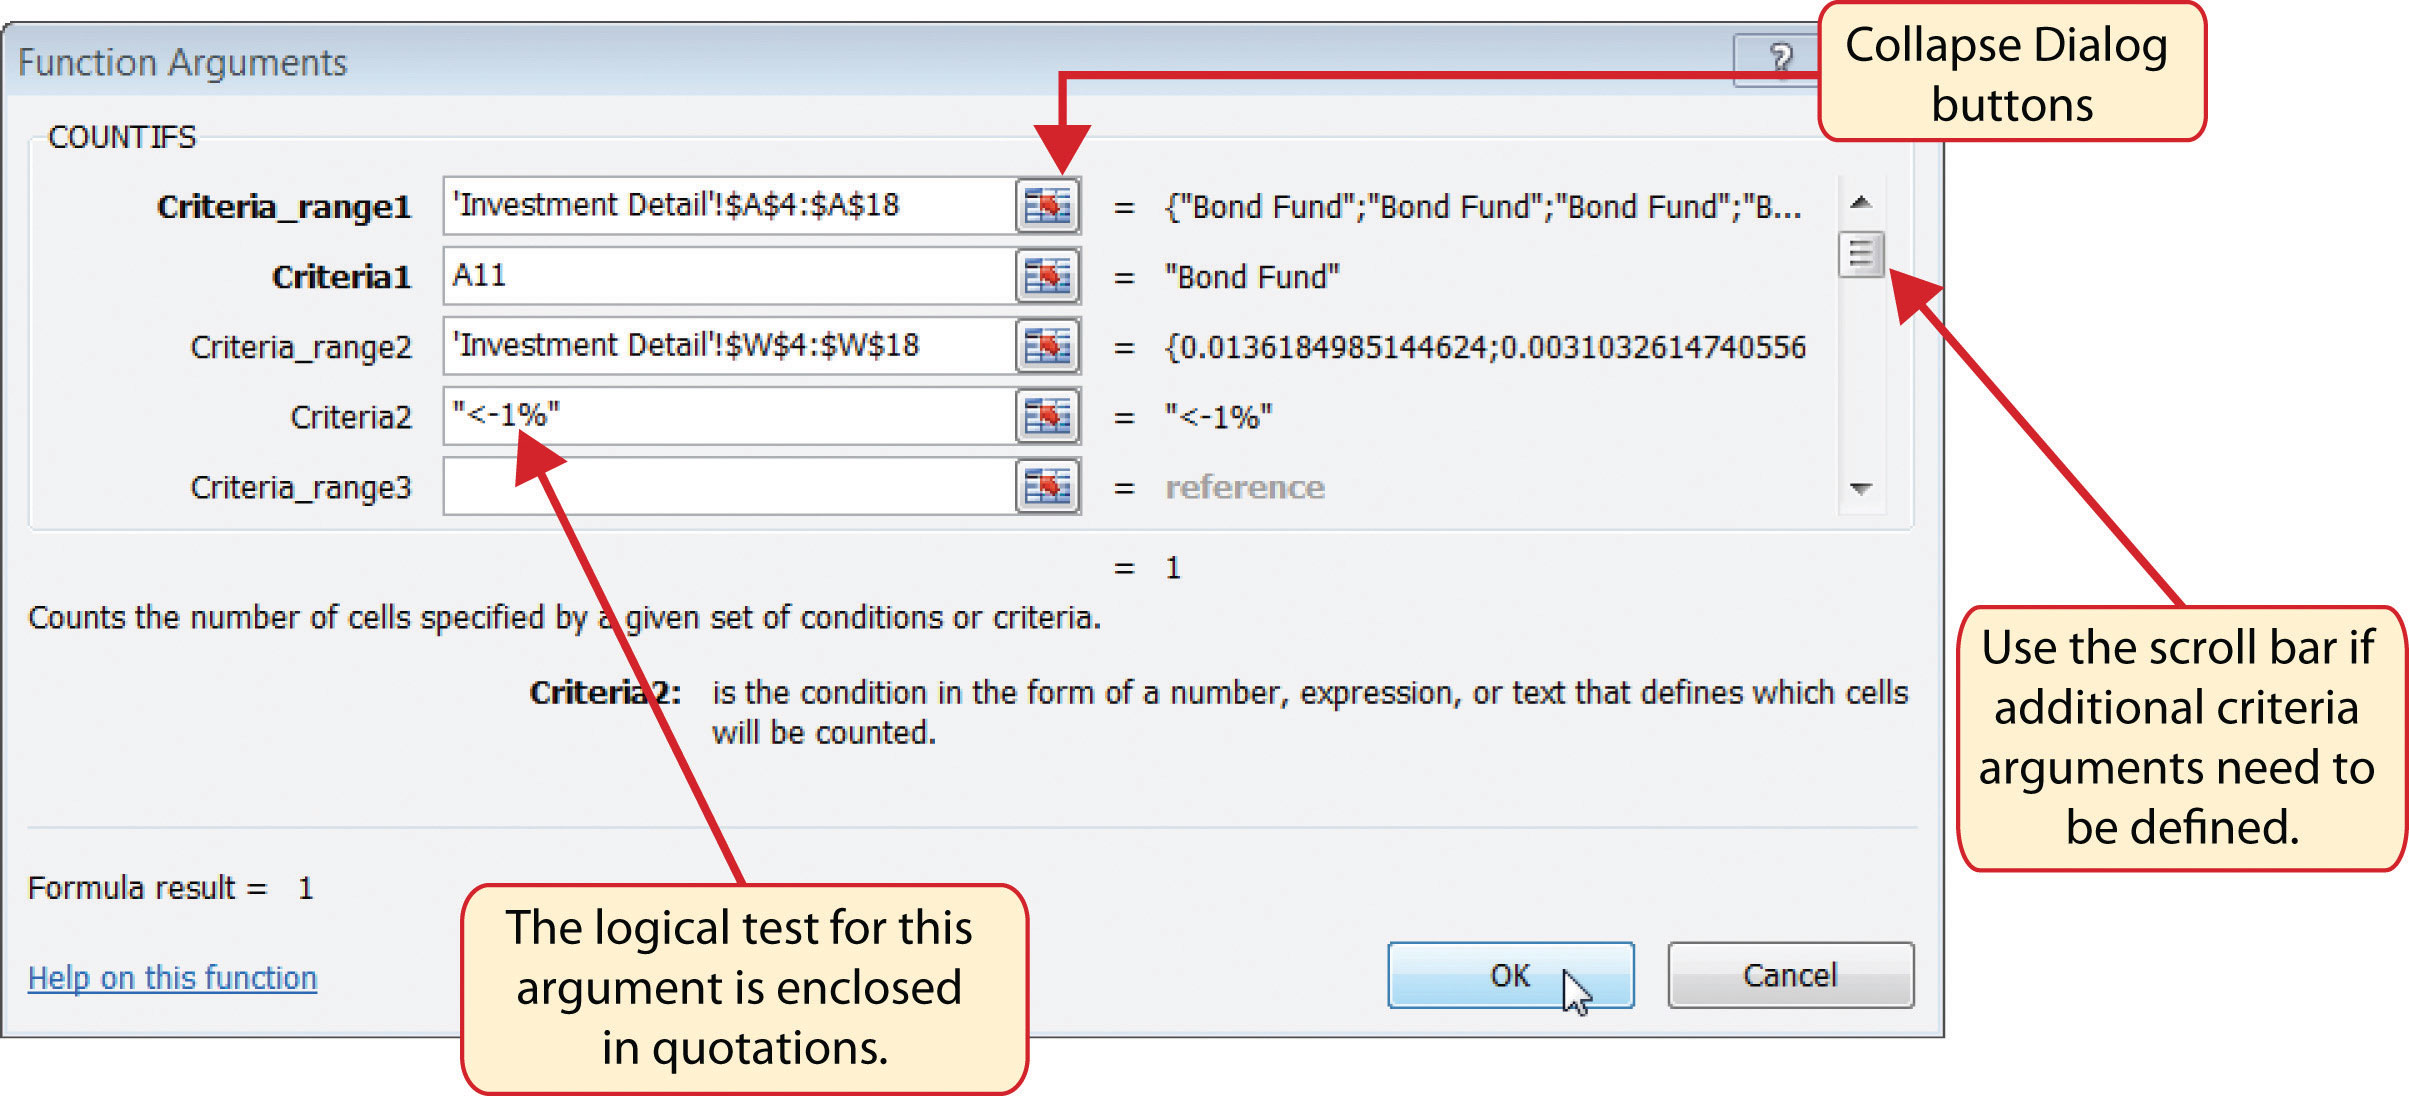
Figure 9 Defined Arguments for the COUNTIFS Function
Figure 10 shows the output of the COUNTIFS function on the Portfolio Summary worksheet. The criteria established for the COUNTIFS function shows that there are a total of seven investments that are underperforming in the portfolio.
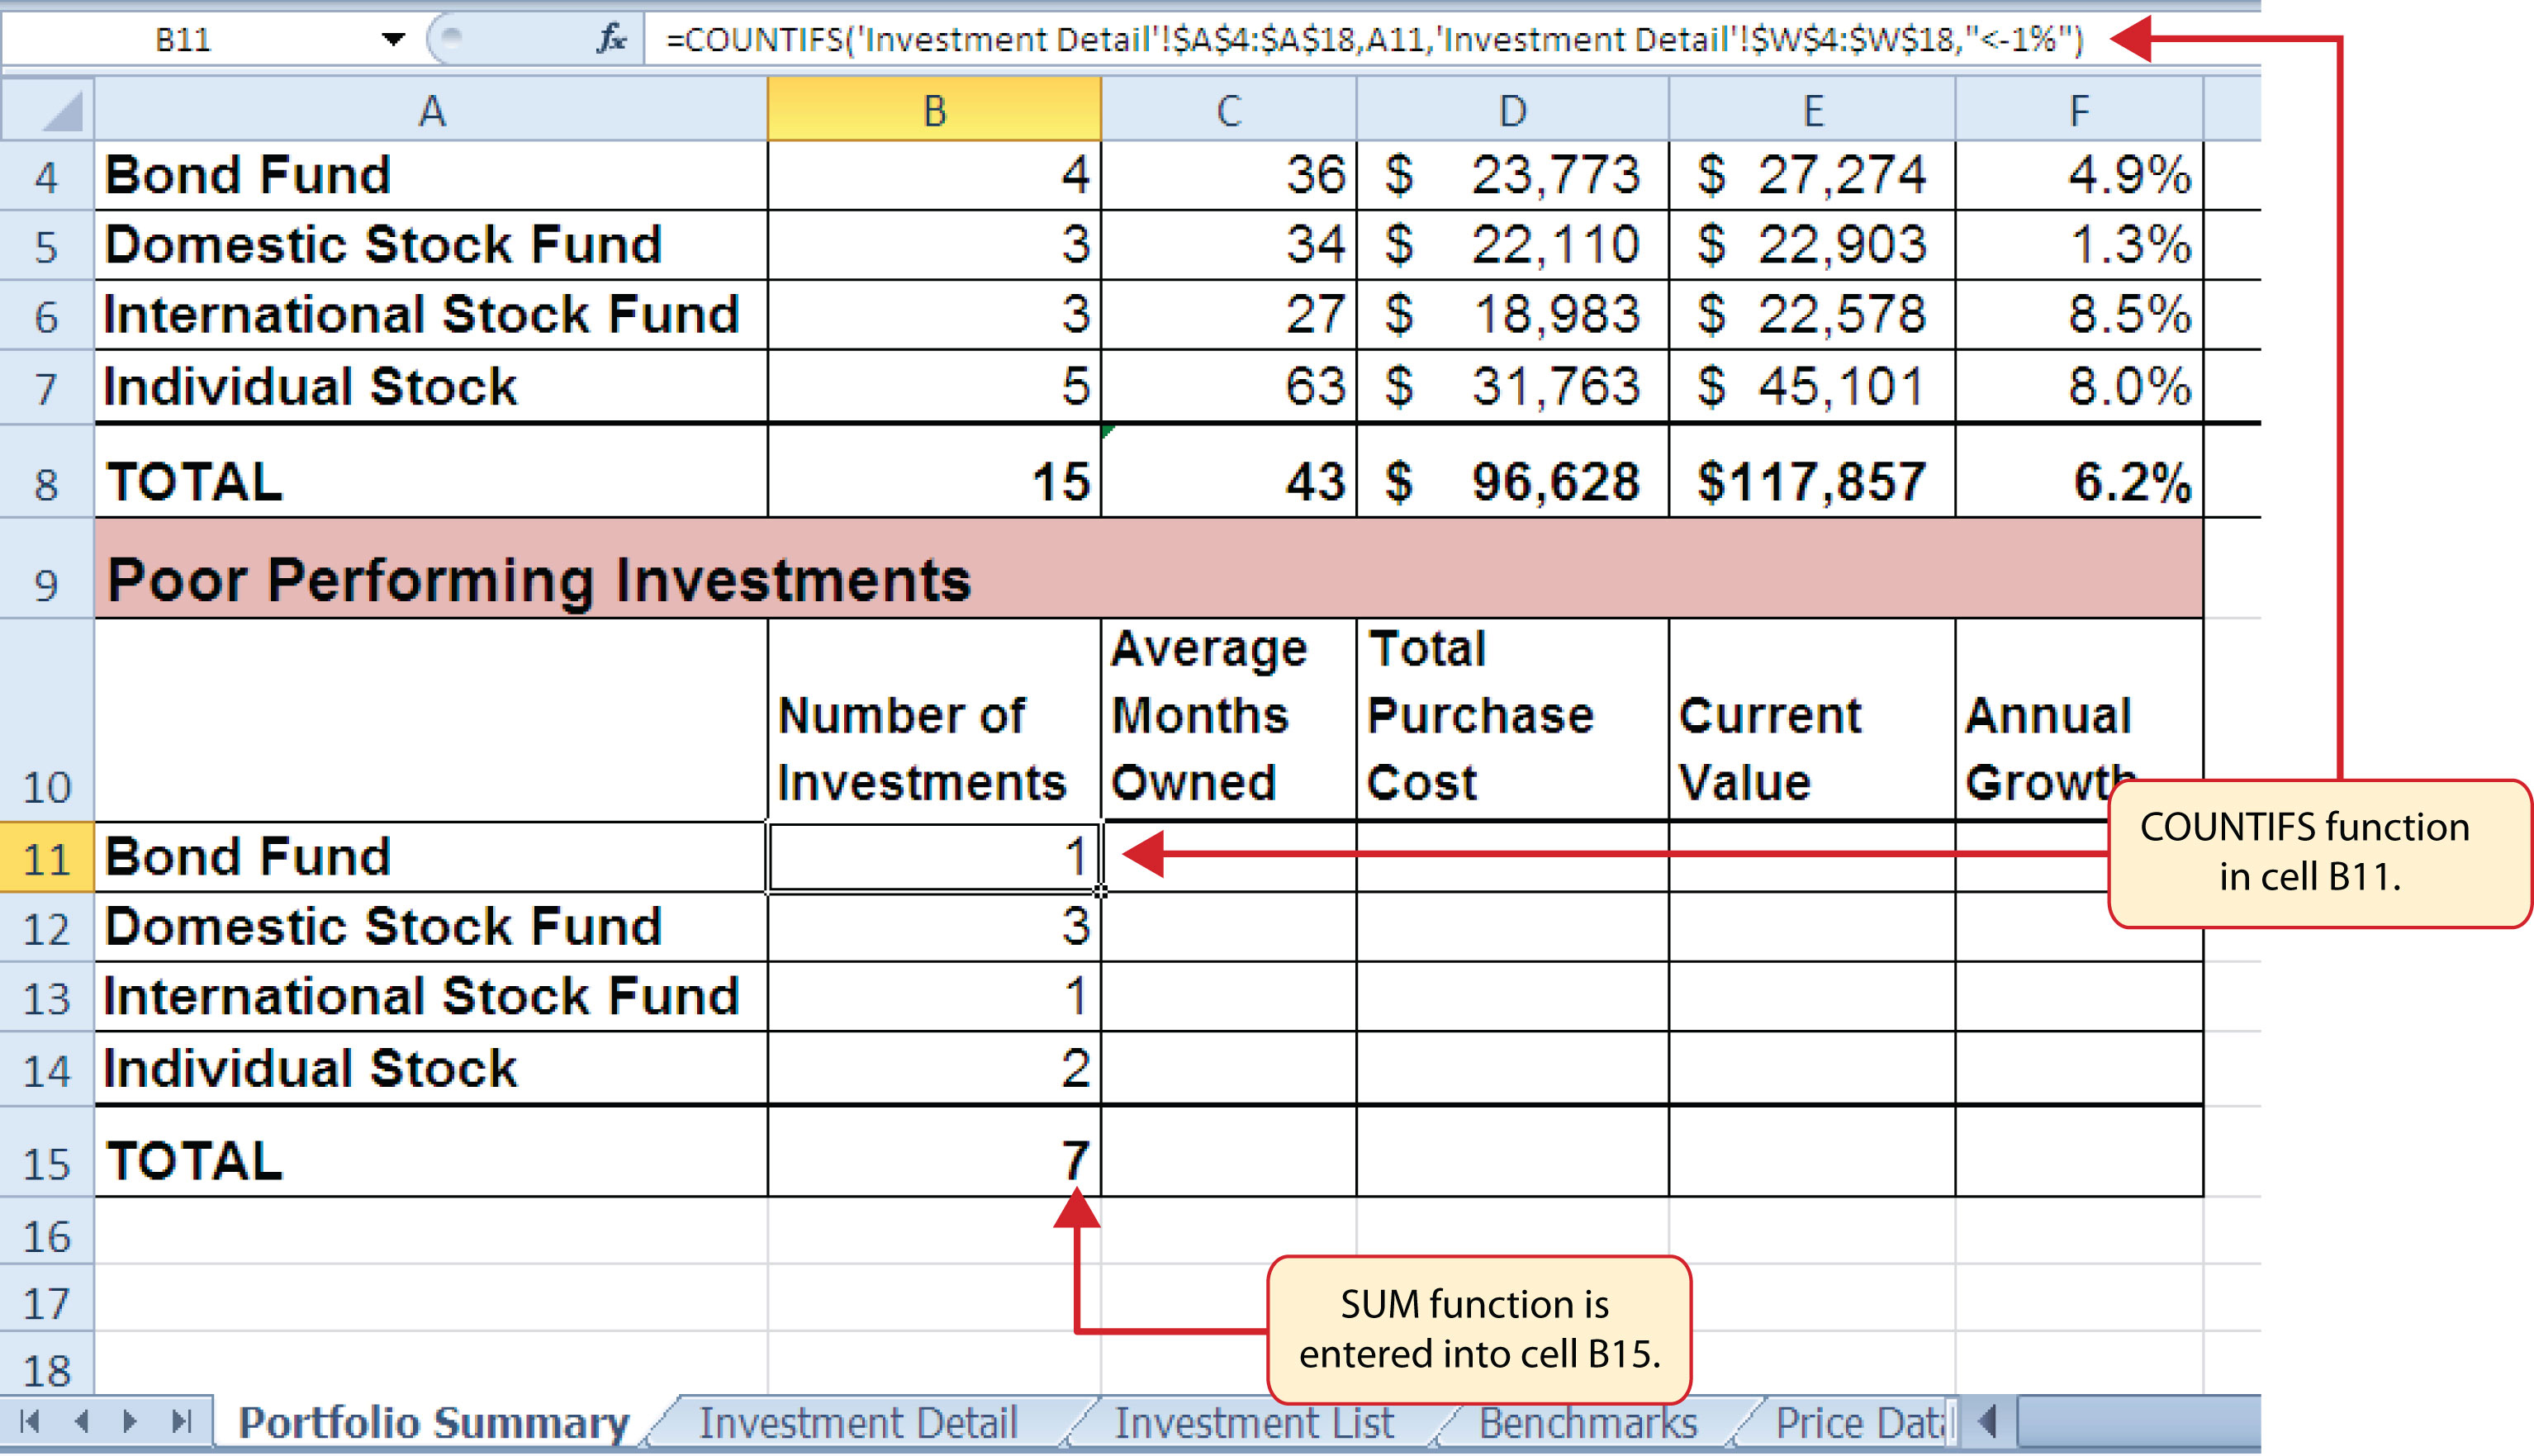
Figure 10 Outputs for the COUNTIFS Functions